Testing Key Resistance, INTC Stock Gains 9.05% Today
On September 9, 2026: price 104.47 USD, trend sideways, RSI 62.0, support 87.26, resistance 104.56. technical analysis of intc stock. Testing Key Resistance —…
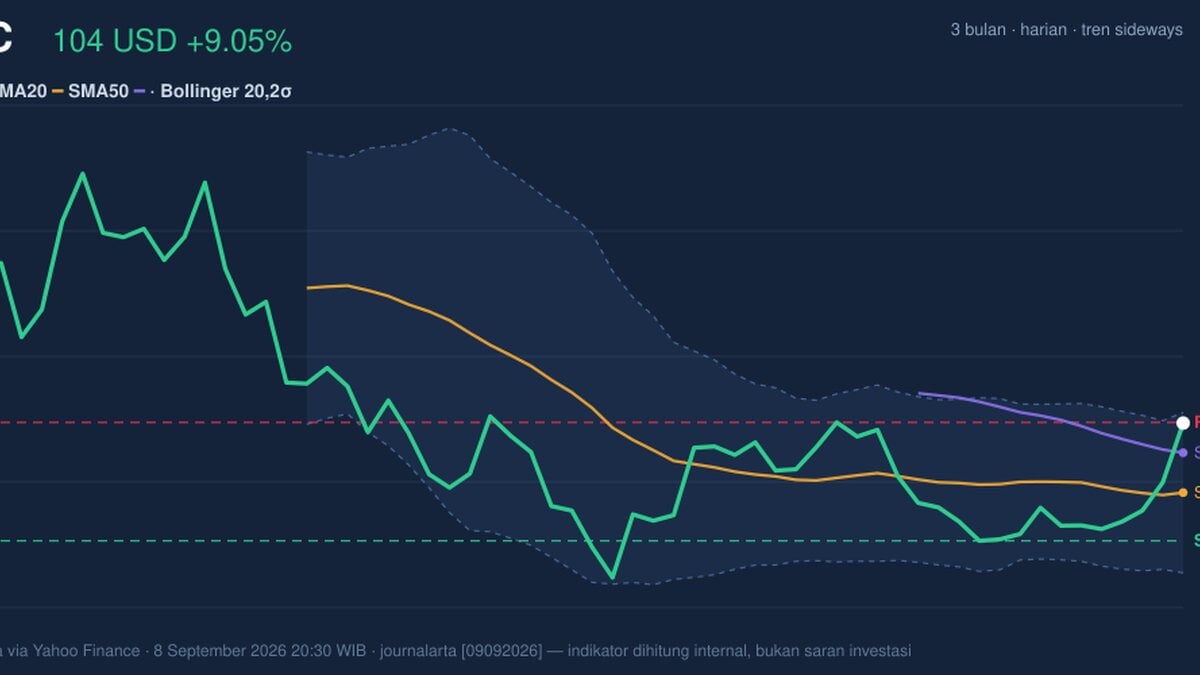
Intel’s latest move puts the stock back near the top of its recent trading band, a sign that buyers are testing whether the rally has room to extend or is simply running into resistance.
Intel (NASDAQ: INTC) closed at 104.47 USD, up 9.05% on the day and 16.71% over five days, according to Yahoo Finance data cited at 8 September 2026 20:30 WIB. That is a meaningful shift for a large-cap chipmaker, because such a fast move usually reflects either a sharp change in sentiment or a market trying to reprice expectations before the next catalyst. Here, the message is less about a smooth trend and more about a stock that has suddenly surged into a zone where technical signals start to disagree.
Trend & Price Action
The broader trend is still described as sideways, and the slope of the SMA20 is still negative at -1.56% over five days. That matters because it says the short-term average is not yet fully confirming the recent jump in price. In plain language, the share price has bounced faster than the trend line has turned, which is often what happens in a rebound phase rather than a fully established uptrend.
Still, Intel is now trading above the SMA20 at 94.30 and also above the SMA50 at 100.13, which is an important change in structure. When price climbs above both averages, traders often read it as the market regaining control after a weaker stretch. The absence of a new MA-cross means there is no fresh long-term trend signal yet, so the move is encouraging but not fully confirmed.
As shown in the chart, the stock is also pressing against the upper end of its recent range, with 20-hour resistance at 104.56 and the last price sitting at 99% of the range. That is a narrow margin. It suggests the market is testing whether the breakout can hold, rather than moving comfortably through open air.
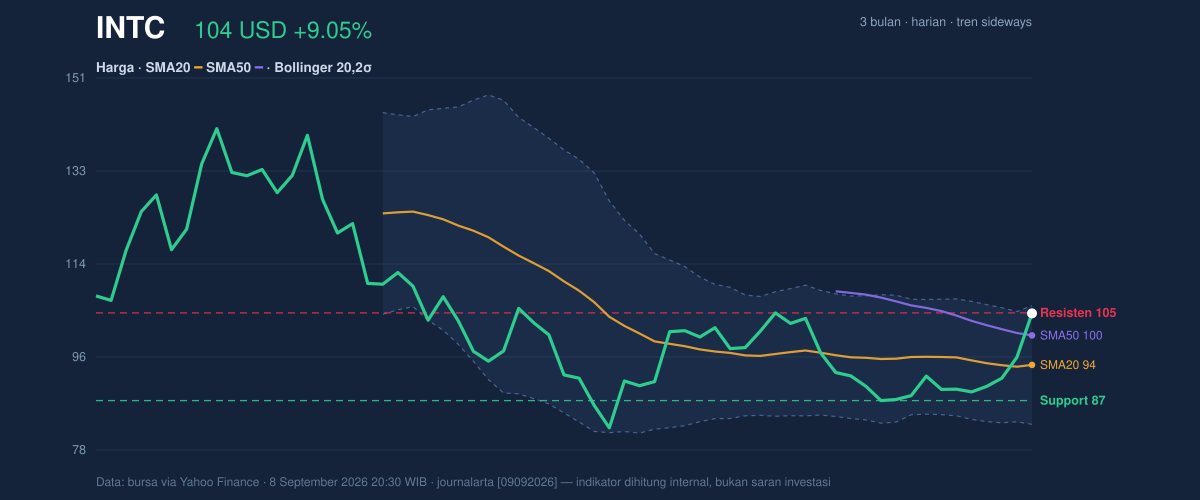
The broader three-month range helps frame the move: Intel has traded between 81.79 and 142.35. The current price is still well below the upper end of that band, but it is now close enough to recent resistance that the next session can matter more than the last one.
Oscillators & Momentum
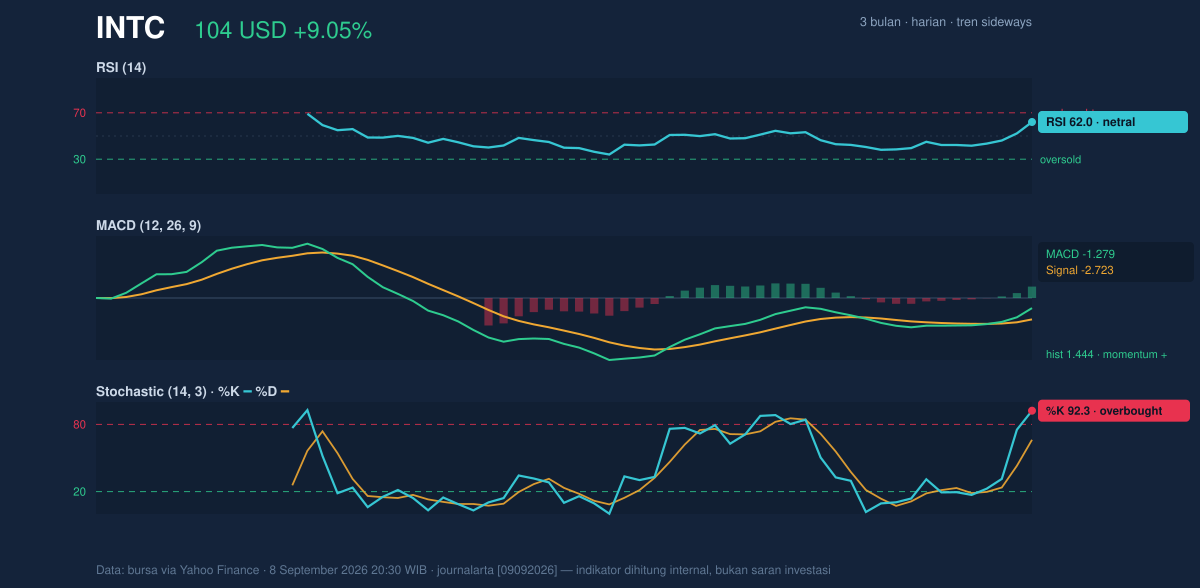
Momentum is mixed, and that is the most important signal in this setup. The RSI at 62.0 is still neutral, which means the stock is not yet technically stretched by that measure. But the Stochastic %K at 92.3 versus %D at 66.3 is clearly overbought, a classic sign that the stock has risen faster than its short-term momentum can comfortably sustain.
That combination usually means the move is strong, but also that it may be vulnerable to a pause or pullback if fresh buyers do not keep arriving. The MACD at -1.279 with a signal line at -2.723 and a positive histogram of 1.444 shows improving momentum underneath the surface. In practical terms, MACD is saying the stock’s trend impulse is turning better, even if it has not yet fully flipped into a clean, durable bullish regime.
The key point is that momentum is not uniform. MACD is positive, which supports the rally, while Stochastic is overbought, which warns that the easy part of the move may already be behind it. That divergence often appears near resistance, where the market needs either a consolidation or a fresh catalyst to keep advancing.
Volatility & Volume
Volatility is elevated. The Bollinger Bands are wide, with the upper band at 106.01, the middle at 94.30, and the lower at 82.58. The band width of 24.9% is described as expanding, which means the stock is not coiling quietly; it is moving with force. Expanding bands often accompany a decisive price move, but they also imply a larger-than-usual swing risk if momentum stalls.
The %B at 93% shows Intel is trading very near the top of the Bollinger envelope. That is a technical way of saying the stock is extended relative to its recent average. It does not automatically mean reversal, but it does mean the price is no longer cheap within its own recent pattern.
Volume strengthens the move. Last volume was 139,808,100, about 1.4x normal versus the 20-session average of 99,812,475, and OBV is rising. That matters because price gains backed by heavier participation tend to be more credible than thin advances. Rising OBV suggests money flow is still supporting the stock, not merely allowing it to drift upward on light trading.
The ATR(14) at 4.40, or 4.2% of price, confirms that daily movement is already elevated. For readers unfamiliar with ATR, it is a measure of how much a stock typically moves in a session; a higher reading means wider swings and less predictable intraday paths.
Key Levels & Scenarios
The immediate technical battleground is tight. Support at 87.26 is the first level that would matter if the current surge loses steam. Below that, the SMA20 at 94.30 is now a more practical pivot because price has moved above it and the market will likely watch whether that average can act as a floor on any pullback.
On the upside, 104.56 resistance is the first hurdle, and the Bollinger upper band at 106.01 is the next visible ceiling. A clean hold above resistance would indicate the rally is trying to convert from a sharp bounce into a more durable advance. Failure to hold that zone would instead suggest the move is running into exhaustion while momentum remains overbought.
Technical Verdict: HOLD (wait & see)
HOLD (wait & see)
- MACD is positive and the histogram is supportive, which confirms improving momentum.
- Stochastic is overbought and price is already near 104.56 resistance, raising the risk of a pause.
- Bollinger Bands are expanding and volume is 1.4x normal, so the move is real, but it is also stretched.
Verdict invalidated if price falls below 94.30, the SMA20 and Bollinger middle band, because that would weaken the current rebound structure.
- Ideal Entry Range: 94.30 to 100.13
- Exit Target: 104.56 to 106.01
- Stop Loss protection: 87.26
For non-traders, that means Intel has improved, but the stock is now close enough to resistance that the next move needs confirmation rather than assumption.
Summary Data INTC
| Last price | 104.47 USD |
| Change 1 day / 5 days / 1 month | 9.05% / 16.71% / 7.13% |
| Trend / MA-cross | sideways / none |
| SMA20 / SMA50 | 94.30 / 100.13 |
| RSI (14) / Stochastic %K | 62.0 / 92.3 |
| Bollinger %B / ATR | 93% / 4.40 |
| Support / Resistance 20 days | 87.26 / 104.56 |
| Data as of | 8 September 2026 20:30 WIB |
Track INTC stock price daily: live levels, support/resistance and our full INTC analysis history.



