UNH Stock Technicals Today: Gains 0.93%, Testing Key Resistance
On September 9, 2026: price 400.84 USD, trend sideways, RSI 49.7, support 384.85, resistance 405.59. technical analysis of unh stock. UNH Stock Technicals —…
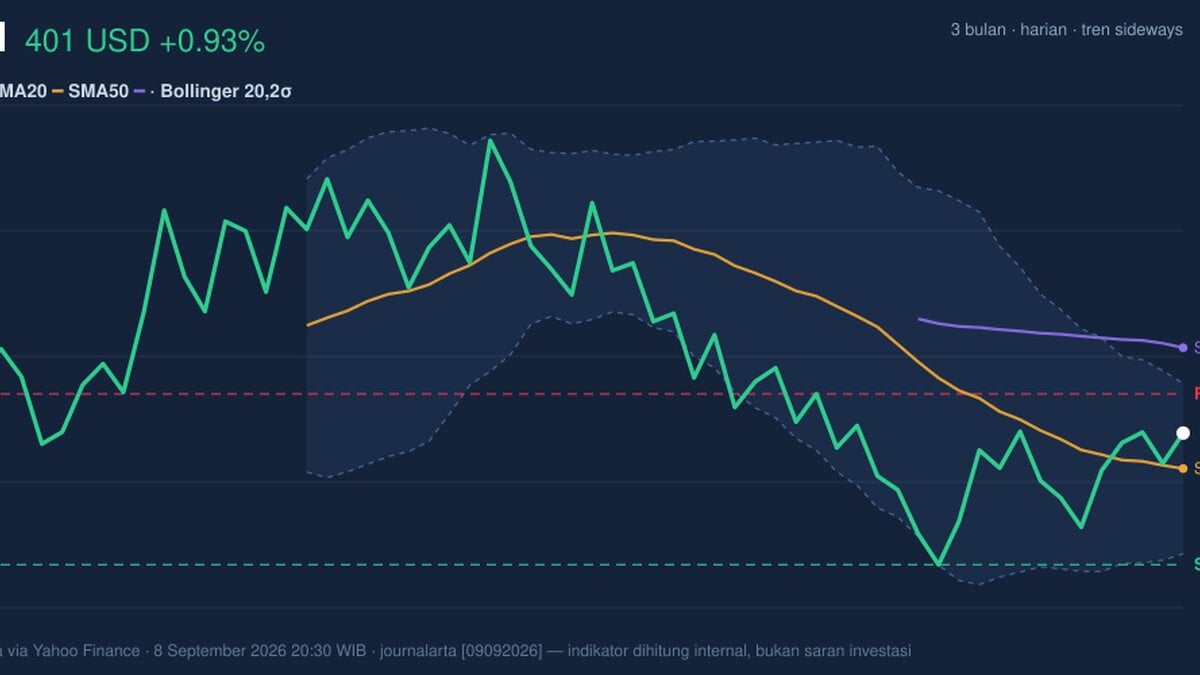
UnitedHealth Group traded higher on the NYSE in New York, with UNH last at $400.84, up 0.93% on the day, as the shares pushed back above the short-term average but still sat well below the longer trend line. The move matters because it shows the stock is not breaking down, yet it is also not reclaiming full trend leadership.
Trend & Price Action
The share price is now above the 20-day simple moving average at $396.52, which is a constructive short-term signal: when price holds above this line, it usually means near-term buyers are still willing to defend the stock after pullbacks. But the broader picture remains less convincing because the 50-day average at $411.20 is still overhead, and that keeps the chart in a sideways-to-cautious posture rather than a clean uptrend.
The slope of the 20-day average is -0.57% over 5 days, so the short-term trend is still leaning down even though price has recently improved. That combination often signals a market trying to stabilize rather than one already in a strong advance. As shown in the chart, UNH is trading near the upper half of its recent band, with price at 77% of the 20-hour range, which tells us the latest bid has real traction but has not yet forced a decisive breakout.
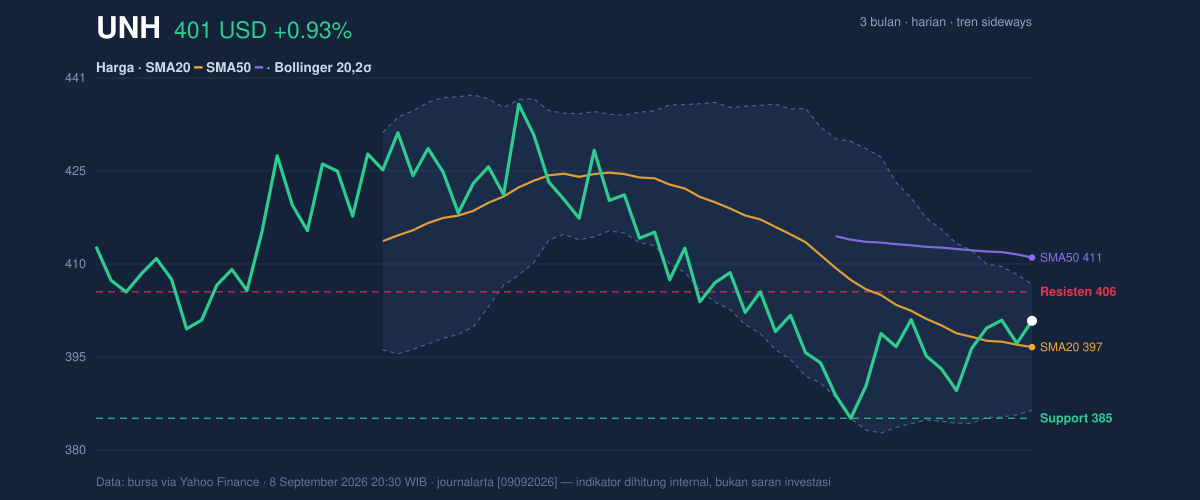
The Bollinger structure adds an important layer. The upper band at $406.86 is now close enough to act as a near-term ceiling, while the band width of 5.2% shows the range is tightening. In plain English, that squeeze means the stock is coiling; compressed volatility often precedes a stronger move, but the direction still needs confirmation. With price at %B 71%, UNH is leaning toward the upper half of the band without being stretched into an obvious overbought extreme.
Oscillators & Momentum
Momentum is mixed, but not weak. The RSI at 49.7 is almost perfectly neutral, which usually means the stock is neither overbought nor oversold and may be waiting for a catalyst. That matters because neutral RSI after a recovery often reflects balance between profit-taking and renewed demand, not exhaustion.
The stochastic reading is a little stronger: %K at 75.9 and %D at 70.5 sit in the upper zone, suggesting recent buying has been firmer than the RSI alone implies. However, because the two lines are still close together, this is more a sign of elevated momentum than a fully mature breakout. The chart, as shown in the momentum panel, suggests the stock is pressing upward but has not yet fully escaped the range.
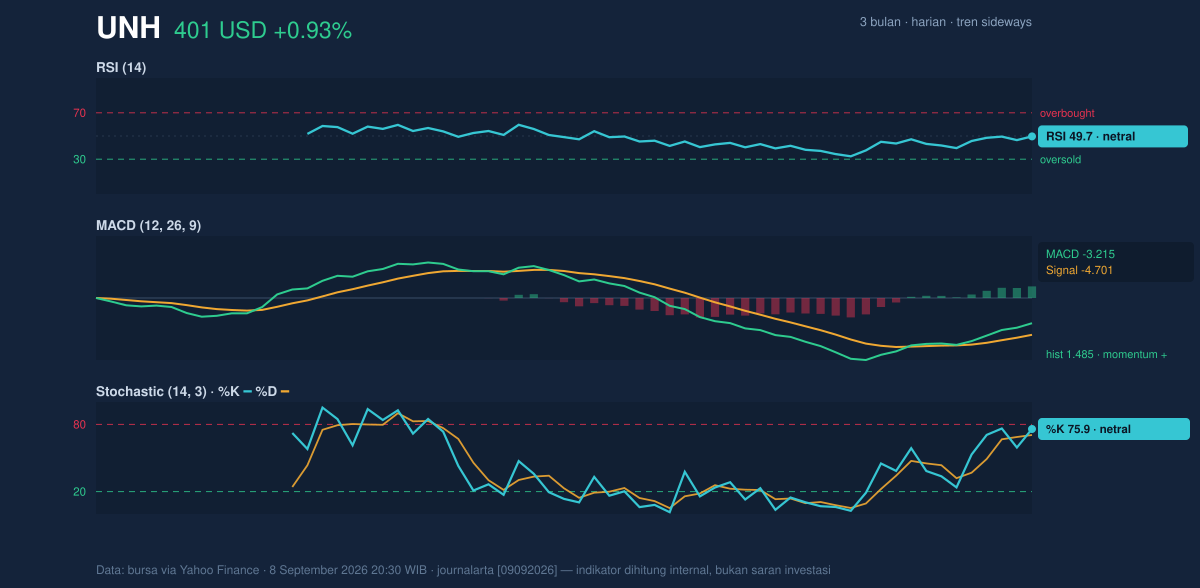
The most encouraging signal is from MACD. MACD at -3.215 remains below zero, which means the longer trend has not fully turned positive, but the histogram at 1.485 and the fact that MACD is above its signal line at -4.701 show improving internal momentum. In practice, that often means downside pressure is fading faster than the headline MACD level suggests. For readers, this is the difference between “still below the line” and “getting closer to crossing it.”
Volatility & Volume
Volume is doing useful work here. UNH traded 7,049,400 shares, about 1.6× its 20-day average of 4,288,050. That kind of participation is important because price gains on heavy volume are generally more credible than gains on thin turnover. The rising OBV, or on-balance volume, reinforces that the latest move has been supported by accumulation rather than a one-off bounce.
Volatility is moderate, not extreme. The ATR at 8.20, equal to about 2.0% of price, suggests daily swings are large enough to matter but not chaotic. Combined with the narrowing Bollinger band, this points to a market that could be preparing for a larger directional move while still trading within a controlled range.
Key Levels & Scenarios
The immediate technical map is clear. Support at $396.52, which is also the SMA20 and Bollinger middle band, is the first level to watch; holding it would keep the rebound intact. Below that, support at $384.85 becomes the deeper line in the sand, and it sits just above the 3-month low of $383.83. That proximity matters because a break there would not just be a minor dip — it would expose the stock to a retest of the recent floor.
On the upside, resistance at $405.59 is the first hurdle, followed by the upper Bollinger band at $406.86. If UNH can clear that zone, the next technical reference is the SMA50 at $411.20, which has been acting as a broader trend barrier. A move through that area would be more meaningful than a simple intraday pop because it would suggest the stock is regaining medium-term structure, not just bouncing inside a range.
Technical Verdict: HOLD (wait & see)
HOLD (wait & see)
- RSI at 49.7 is neutral, so momentum is not strong enough to call a decisive trend change.
- MACD histogram at 1.485 is positive and improving, but MACD remains below zero at -3.215, so the broader trend has not fully turned.
- Price above the SMA20 at $396.52 is constructive, yet the SMA50 at $411.20 and resistance at $405.59/$406.86 still cap the chart.
Verdict invalidated if price falls below $384.85, because that would break the deeper support area and threaten the recent stabilization.
- Ideal Entry Range: $396.52 to $405.59
- Exit Target: $406.86 to $411.20
- Stop Loss protection: below $384.85
For non-traders, this means UNH is improving, but it still needs to prove that the recent bounce can turn into a real trend before the chart looks decisively stronger.
Summary Data UNH
| Last price | 400.84 USD |
| Change 1 day / 5 days / 1 month | 0.93% / 2.94% / -1.93% |
| Trend / MA-cross | sideways / none |
| SMA20 / SMA50 | 396.52 / 411.20 |
| RSI (14) / Stochastic %K | 49.7 / 75.9 |
| Bollinger %B / ATR | 71% / 8.20 |
| Support / Resistance 20 days | 384.85 / 405.59 |
| Data as of | 8 September 2026 20:30 WIB |
Track UNH stock price daily: live levels, support/resistance and our full UNH analysis history.



