VZ Stock Gains 0.54% Today, Testing Key Resistance
On September 9, 2026: price 50.41 USD, trend uptrend, RSI 64.5, support 46.98, resistance 50.59. technical analysis of vz stock. VZ Stock Gains — full details…
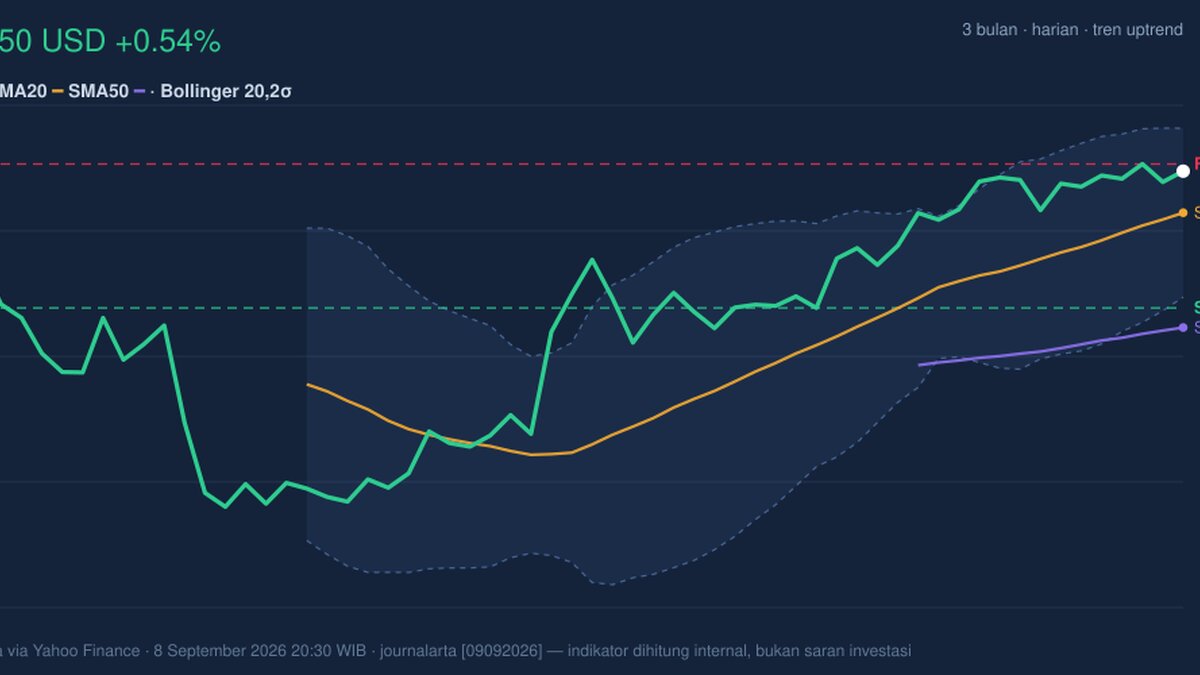
Verizon Communications Inc. traded higher on the NYSE on 8 September 2026, with VZ last at 50.41 USD, up 0.54% on the day and 7.19% over the past month, as the stock stayed near the top of its recent range. The move matters because it is not a stand-alone bounce: price is trading above both the SMA20 at 49.37 and the SMA50 at 46.49, which tells market participants that the medium-term structure remains constructive even though short-term momentum is no longer perfectly synchronized.
Trend & Price Action
The chart shows VZ in a clear uptrend, but one that is starting to look mature rather than explosive. The SMA20 is rising 1.78% over 5 days, which signals that the recent advance still has upward slope; in plain language, the short-term average is climbing fast enough to confirm demand has been present. At the same time, there is no fresh MA-cross, so the rally is not being driven by a new moving-average crossover event. That usually means the market has already digested the initial trend shift, and traders are now watching whether price can keep holding above the faster average.
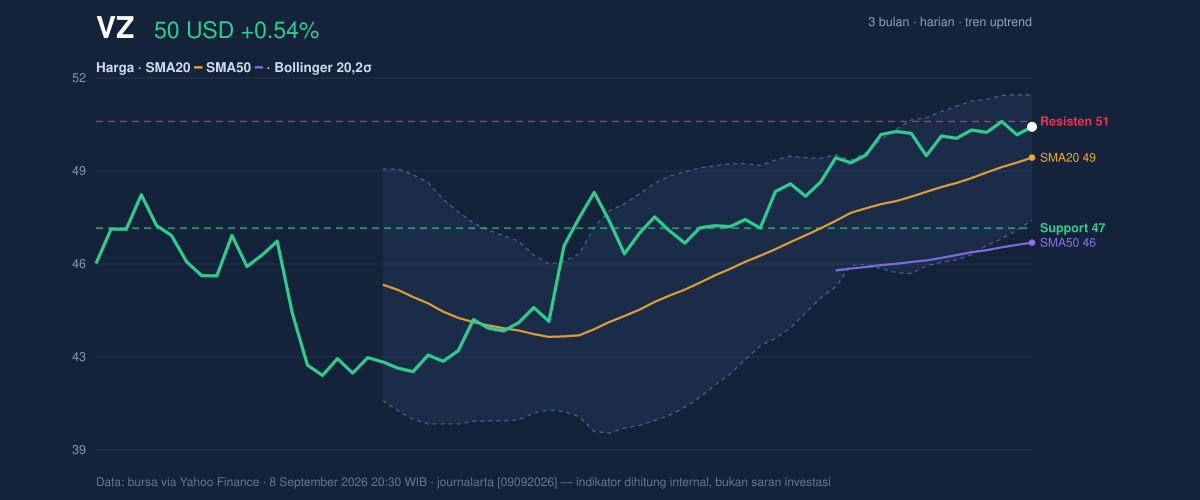
Price is also sitting at 95% of the 20-hour range, with support at 46.98 and resistance at 50.59. That positioning is important: when a stock trades this close to the top of its range, it often implies buyers have been willing to pay up, but it also leaves less room for easy continuation unless a breakout attracts fresh volume. The stock’s 3-month high is 50.93, so the current level is already pressing toward the upper edge of the broader recent band. That makes the next move less about trend direction and more about whether VZ can clear nearby resistance cleanly.
Oscillators & Momentum
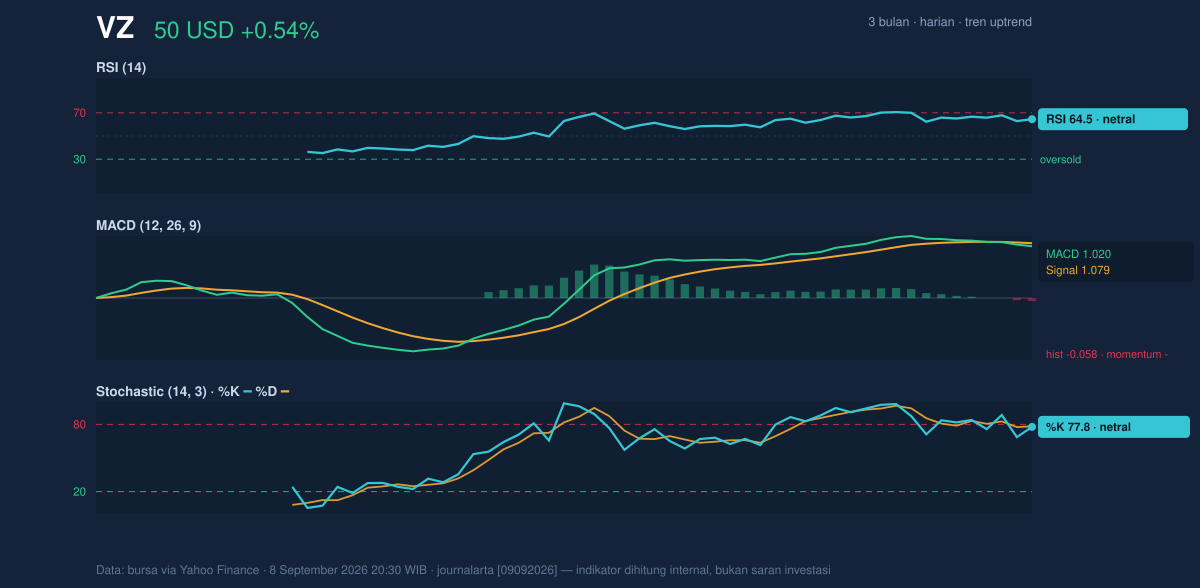
Momentum is more mixed than the price chart alone suggests. RSI at 64.5 is still technically neutral, but it sits close to the upper end of the neutral zone, which often indicates a stock is strong without yet being stretched into obvious overbought territory. Stochastic %K at 77.8 and %D at 78.3 also read neutral, but they are elevated enough to show the stock has been trading near the top of its recent price distribution. In practical terms, that means the trend has not broken, but the easy part of the move may already be behind it.
The more cautionary signal comes from MACD at 1.020, which remains above zero but is below its signal line at 1.079, leaving a histogram of -0.058. That negative histogram matters because it shows short-term momentum has weakened even while price continues to hold up. This is a classic divergence setup: price can still rise, but the internal push behind the move is less forceful than it was. For non-specialists, that means the stock is not rolling over, but it is no longer accelerating.
Volatility & Volume
Volatility is neither compressed nor extreme. The Bollinger Bands place the upper band at 51.49, the middle band at 49.37, and the lower band at 47.25, with %B at 75% and band width at 8.6%. A %B reading near 75% means price is trading in the upper portion of the band structure, usually a sign of strength, but not necessarily a breakout. Because the band width is described as normal, this is not a squeeze setup where a sharp expansion is being telegraphed. Instead, the market appears to be moving in an orderly manner, leaving room for either a measured push higher or a pause.
ATR adds useful context here. ATR(14) at 0.76, or 1.5% of price, points to moderate day-to-day movement. That is enough to allow a meaningful move through resistance, but not so high that the chart is being driven by disorderly swings. Volume also supports the current trend without shouting conviction: 16,036,300 shares traded versus a 20-day average of 16,707,655, or about 1.0× normal. In other words, the advance is happening on roughly average participation rather than a surge of new trading interest. The positive detail is that OBV is rising, which suggests accumulation has been building underneath the price action even if the latest session was not unusually heavy.
Key Levels & Scenarios
The immediate technical map is straightforward. Resistance at 50.59 is the first barrier, and the stock is close enough to test it soon. Above that, the 3-month high at 50.93 becomes the next reference point. On the downside, support at 46.98 is the level that would matter most if the current advance loses traction. The SMA20 at 49.37 is also important because it acts as a short-term trend line; holding above it keeps the recent advance intact.
If VZ clears 50.59 and then moves through 50.93, the chart would shift from a range-bound advance into a more convincing continuation pattern. If it fails to hold 49.37, the message changes quickly: the stock would still be above the SMA50 at 46.49, but the short-term trend would look less reliable, especially with MACD already softening.
Technical Verdict: HOLD (wait & see)
HOLD (wait & see) fits the current setup because the trend is positive, but momentum is not fully aligned with price.
- Reason 1: Trend support — price is above the SMA20 at 49.37 and SMA50 at 46.49, and the SMA20 slope is rising 1.78% over 5 days.
- Reason 2: Momentum is positive but fading — RSI 64.5 and Stochastic 77.8/78.3 show strength, while the MACD histogram at -0.058 warns that internal momentum has softened.
- Reason 3: Price is near resistance — the stock is close to 50.59 resistance and the 50.93 three-month high, so upside confirmation still needs to be earned.
- Verdict invalidated if price falls below 46.98, because that would break the defined support and weaken the current trend structure.
- Ideal Entry Range: 49.37 to 50.41
- Exit Target: 50.59 to 50.93
- Stop Loss protection: below 46.98
In plain English, Verizon looks steady and constructive, but the chart is asking for confirmation before the next leg higher. “The stock is still standing near its highs, but the market is no longer moving with the same force,” one trader could say as the shares hover just under resistance.
Summary Data VZ
| Last price | 50.41 USD |
| Change 1 day / 5 days / 1 month | 0.54% / 0.78% / 7.19% |
| Trend / MA-cross | uptrend / none |
| SMA20 / SMA50 | 49.37 / 46.49 |
| RSI (14) / Stochastic %K | 64.5 / 77.8 |
| Bollinger %B / ATR | 75% / 0.76 |
| Support / Resistance 20 days | 46.98 / 50.59 |
| Data as of | 8 September 2026 20:30 WIB |
Track VZ stock price daily: live levels, support/resistance and our full VZ analysis history.



