Alibaba Stock Gains 0.27% Today, Momentum Weakens
On September 10, 2026: price 109.80 HKD, trend sideways, RSI 40.9, support 107.50, resistance 126.70. technical analysis of alibaba stock.
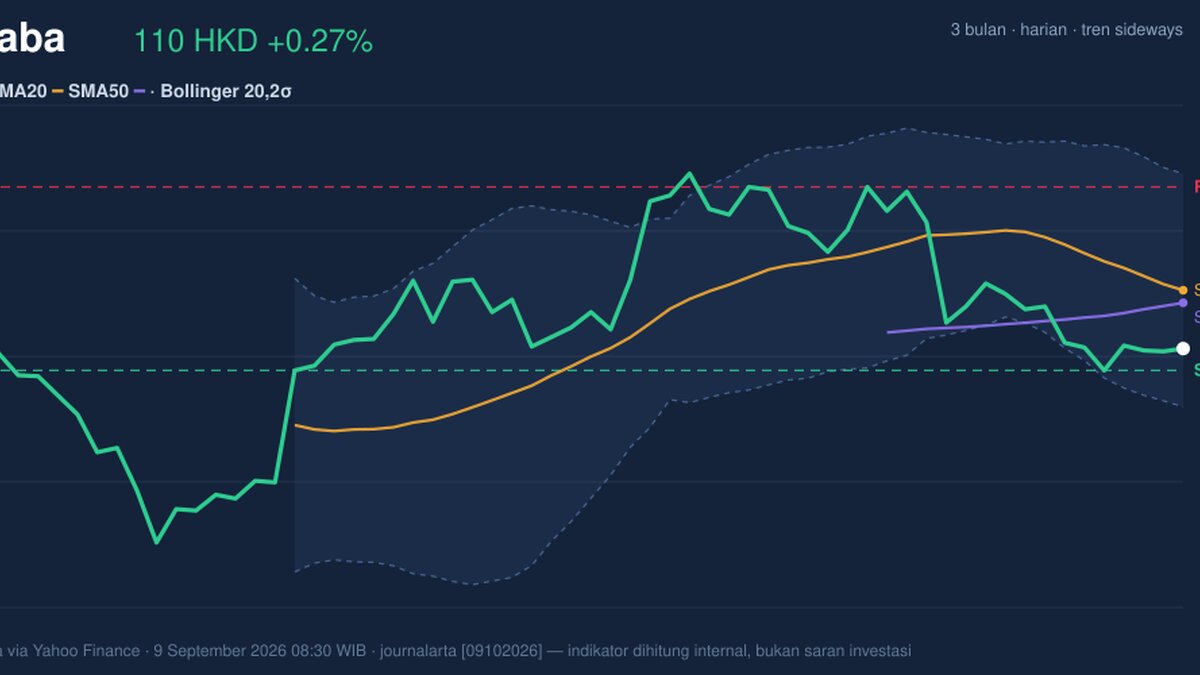
Alibaba Group’s Hong Kong-listed shares fell back to HK$109.80 on the HKEX, leaving the stock below its short- and medium-term trend lines and still under pressure after a -10.44% one-month slide, according to exchange data cited by Yahoo Finance.
The move matters less for the day’s tiny 0.27% gain and more for what it says about positioning: the stock is trading in the lower part of its recent range, with momentum still negative even as some short-term oscillators hint at exhaustion. In plain terms, the chart is not showing a clean reversal yet — it is showing a market trying to stabilise inside a broader downshift.
Trend & Price Action
Alibaba’s current setup is best described as a sideways market with a downward bias. The HK$109.80 last price sits below SMA20 at HK$115.89 and below SMA50 at HK$114.58, which means the stock is trading under both its near-term and intermediate trend gauges. That matters because moving averages are often watched as a rough map of trend direction: when price stays below them, rallies tend to face selling pressure until the stock can reclaim those lines.
The SMA20 slope of -3.23% over 5 days reinforces that the short-term trend is still easing lower rather than flattening out. There is no new MA cross, so there is no fresh technical signal of a trend reversal. As shown in the chart, price is also sitting near the lower half of the Bollinger channel rather than pressing the upper band, which tells readers the market has not yet shifted into a strong recovery phase.
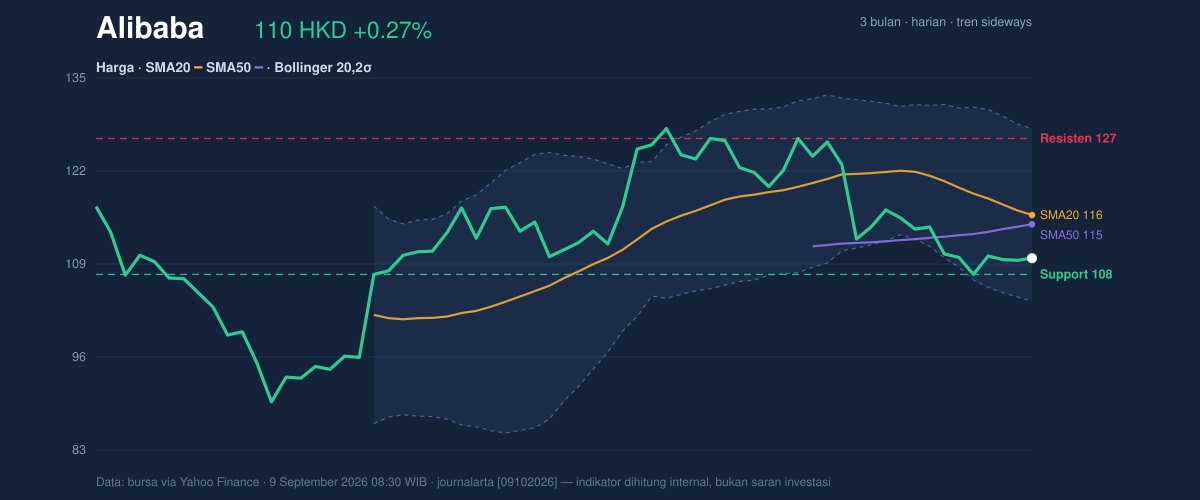
The range tells a more nuanced story. The stock is trading around 12% of the 20-day range, with support at HK$107.50 and resistance at HK$126.70. That places Alibaba much closer to the floor than the ceiling, but proximity to support is not the same as confirmation. It simply means the market is testing whether buyers will defend that area.
Short line: the chart is near support, but it has not escaped the downtrend.
Oscillators & Momentum
Momentum indicators are mixed, and that mix is important. The RSI at 40.9 is neutral, which suggests the stock is not oversold on a broad momentum basis and not overbought either. By itself, that reading is more consistent with indecision than with a decisive breakout.
The Stochastic %K at 14.2 and %D at 13.4 is in oversold territory, which often means the stock has been weak enough to stretch short-term selling. But oversold does not automatically mean reversal; it only says the decline may be mature. The key question is whether price can turn that stretched condition into actual buying interest.
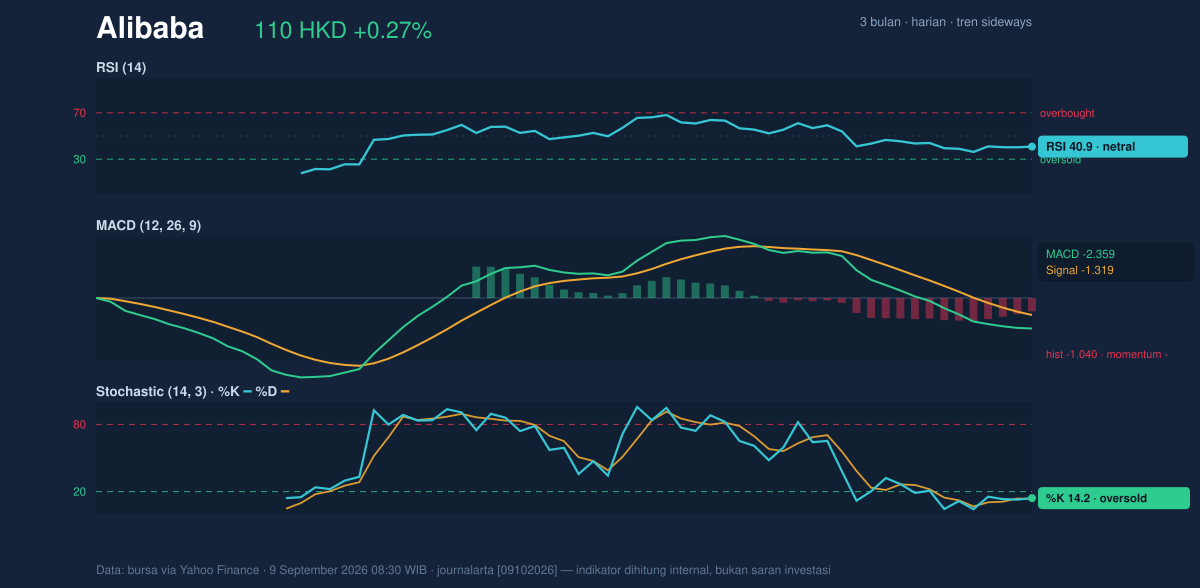
That is where the MACD at -2.359 remains the clearest warning. With the signal line at -1.319 and the histogram at -1.040, the MACD is still below zero and below its signal line, showing negative momentum is still dominant. In practical terms, the bears still have the upper hand even if the pace of decline is not accelerating sharply.
Short line: oversold Stochastic can hint at a bounce, but MACD remains negative.
Volatility & Volume
Volatility is elevated. The Bollinger Bands show the upper band at HK$128.09, the middle band at HK$115.89, and the lower band at HK$103.69, with %B at 25%. That means price is sitting near the lower quarter of the band structure, a zone that often reflects pressure rather than strength. At the same time, the 21.1% band width is expanding, which signals higher volatility. When bands widen, the market is usually preparing for larger swings rather than settling into calm trade.
The ATR(14) at 4.24, equal to 3.9% of price, confirms that daily movement can remain wide. ATR measures the average range of recent trading sessions, so a higher reading means stops and rebounds can both be sharper than usual.
Volume, however, is not confirming a strong move. Last volume was 46,572,012, about 0.5x the 20-session average of 96,735,252, and OBV is falling. OBV, or on-balance volume, tracks whether volume is flowing with price or against it; a declining OBV suggests distribution rather than accumulation. That is a caution flag because a price bounce without volume support can fade quickly.
Short line: volatility is high, but participation is thin.
Key Levels & Scenarios
The immediate technical map is straightforward. HK$107.50 is the nearest support to watch, while HK$126.70 is the first meaningful resistance. Below that, the Bollinger lower band at HK$103.69 becomes the next reference point if selling deepens. Above, the middle Bollinger band at HK$115.89 and SMA20 at HK$115.89 are the first hurdles; reclaiming that area would be the earliest sign that the stock is trying to repair its trend.
If price holds HK$107.50 and momentum improves, a bounce toward HK$115.89 would be the first technical test. If it fails to hold that support, the chart opens the door toward the HK$103.69 lower Bollinger band, where volatility could intensify.
Technical Verdict: HOLD (wait & see)
HOLD (wait & see)
- Price is below SMA20 and SMA50, so the trend remains weak despite the recent pause in selling.
- MACD is negative and still below its signal line, which says downside momentum has not fully cleared.
- Stochastic is oversold, but OBV is falling and volume is only 0.5x average, so any rebound lacks strong participation so far.
- Verdict invalidated if price breaks below HK$107.50, because that would put the nearest support under direct pressure and raise the risk of a move toward HK$103.69.
- Ideal Entry Range: HK$107.50 to HK$109.80, only if support holds and price stabilises
- Exit Target: HK$115.89 first, then HK$126.70 if strength extends
- Stop Loss protection: below HK$103.69
For non-traders: the stock is close to support, but the chart still needs proof that buyers are back.
Alibaba’s 3-month high and low are HK$130.30 and HK$88.65.
Summary Data Alibaba
| Last price | 109.80 HKD |
| Change 1 day / 5 days / 1 month | 0.27% / -0.09% / -10.44% |
| Trend / MA-cross | sideways / none |
| SMA20 / SMA50 | 115.89 / 114.58 |
| RSI (14) / Stochastic %K | 40.9 / 14.2 |
| Bollinger %B / ATR | 25% / 4.24 |
| Support / Resistance 20 days | 107.50 / 126.70 |
| Data as of | 9 September 2026 08:30 WIB |
Track Alibaba share price daily: live levels, support/resistance and our full Alibaba analysis history.



