AstraZeneca Stock Analysis: Drops 3.26%, Momentum Gains
On September 10, 2026: price 11,650.00 GBp, trend sideways, RSI 43.4, support 11,460.00, resistance 12,476.00. technical analysis of astrazeneca stock.
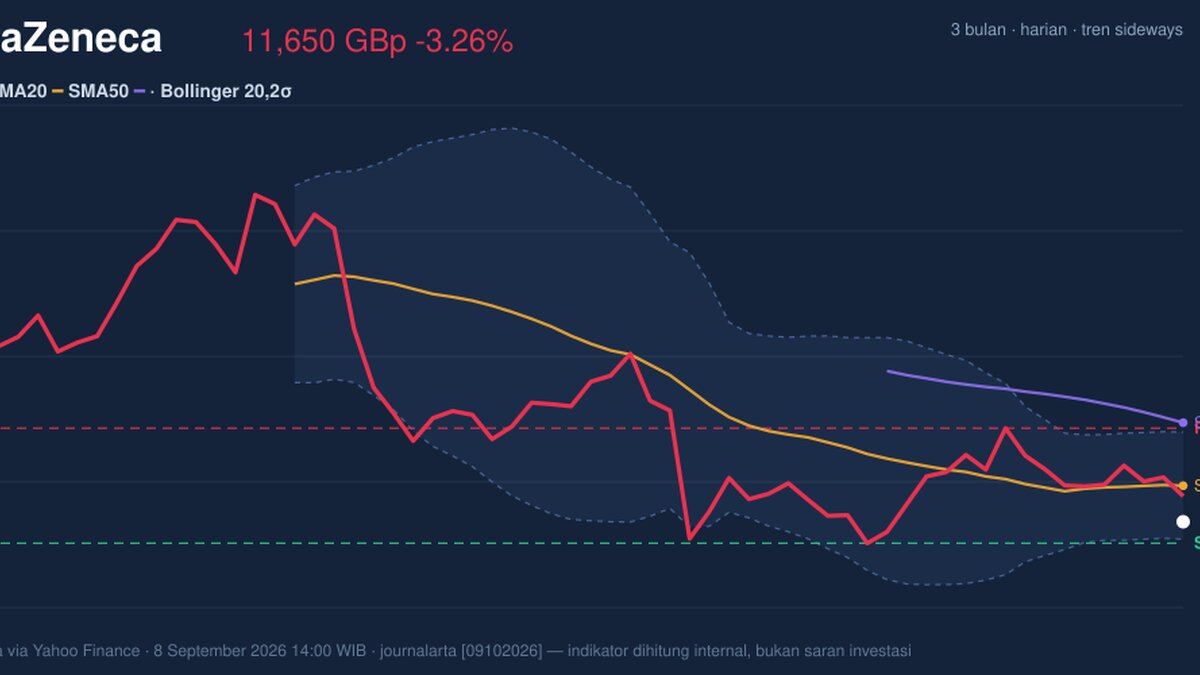
The London-listed shares of AstraZeneca fell to 11,650.00 GBp in late trading, down 3.26% on the day, as the stock slipped back below its short-term average and tested the lower half of a tightening range, according to data from the LSE via Yahoo Finance at 8 September 2026 14:00 WIB. The move matters because it shows a market that is not breaking down decisively, but is also failing to reclaim the levels that usually signal renewed confidence. In plain terms, AstraZeneca is still moving sideways, yet the balance of pressure has shifted toward sellers for now.
Trend & Price Action
As shown in the chart, AstraZeneca is trading below the SMA20 at 11,968.50 and well under the SMA50 at 12,524.60, which tells readers the share price is sitting beneath both the short- and medium-term trend markers. That is not the profile of a stock in a clean uptrend. It means recent buying has not been strong enough to drag price back above the levels traders often use as confirmation that momentum is improving.
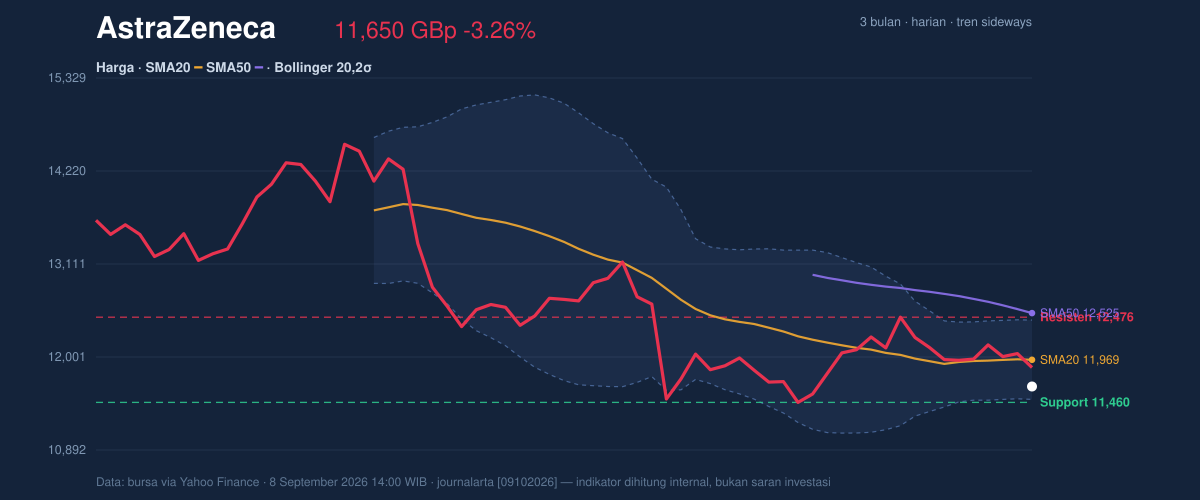
The broader structure is still described as sideways, and the SMA20 slope of 0.22% over 5 days suggests the short-term trend is only gently rising, not accelerating. That combination usually points to a market waiting for a catalyst. The share price is also near the lower end of the day’s technical range, with support at 11,460.00 and resistance at 12,476.00; at 19% of the range, the stock is positioned much closer to support than resistance. That placement matters because it leaves less room before the market has to decide whether buyers are willing to defend the floor.
The Bollinger Bands reinforce that tension. Price is near the lower band at 11,495.83, with the middle band at 11,968.50 and the upper band at 12,441.17. A %B of 16% means the stock is trading close to the lower edge of its recent volatility envelope, not in a stretched upside condition. The 7.9% band width is also relatively tight, which signals a squeeze: volatility has compressed, and compressed markets often precede a sharper move once price escapes the range. In other words, the current calm is more likely to be temporary than permanent.
Oscillators & Momentum
The momentum picture is mixed rather than bearish across the board. RSI(14) at 43.4 sits in neutral territory, which means the stock is neither oversold nor overbought. That is important because it suggests the recent decline has not yet reached the kind of exhaustion that would normally force a rebound on its own.
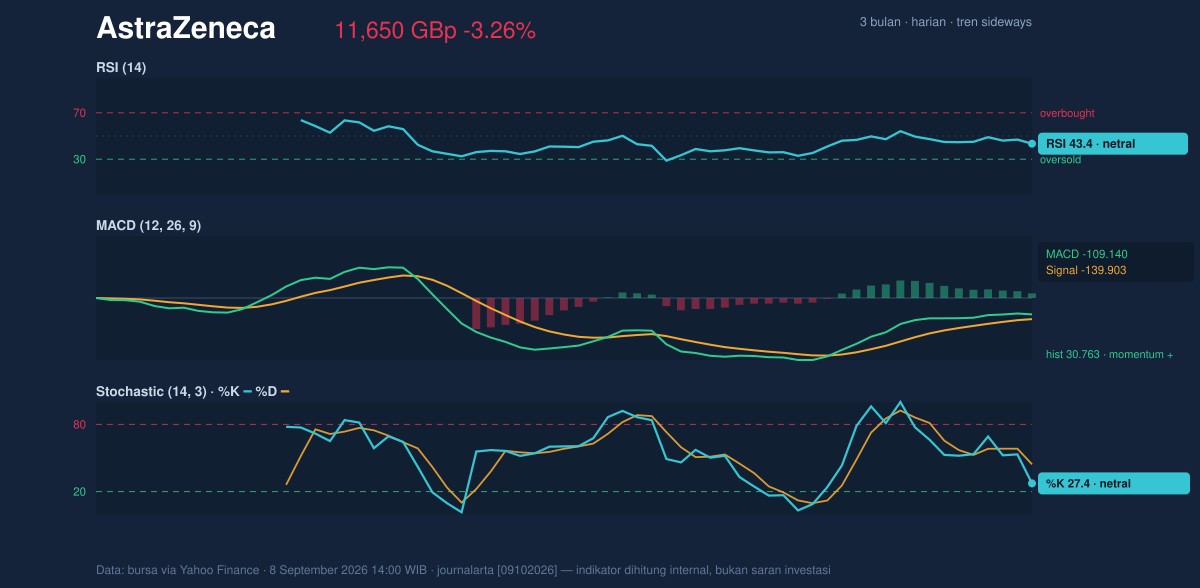
The Stochastic %K at 27.4 versus %D at 44.3 points to short-term weakness, but not a full breakdown. For general readers, stochastic compares the latest price to its recent range; when it sits low, it can show that the stock is near the weaker end of that range. Here, it hints that sellers still have the upper hand in the immediate term, though the reading is not extreme enough to call the share deeply oversold.
The more interesting signal comes from MACD. MACD at -109.140 remains below zero, which usually reflects a still-negative medium-term trend. But the histogram at 30.763 and the fact that MACD is above the signal line at -139.903 indicate positive momentum is building from a weak base. That is a subtle but important distinction: the stock is not in a confirmed recovery, yet the downside impulse is losing force. The chart shows a market that may be trying to turn, even if price has not validated that attempt yet.
Volatility & Volume
Volatility is present, but not in a disorderly way. ATR(14) at 295.03, equal to 2.5% of price, indicates moderate volatility. ATR, or average true range, is a measure of how much the share tends to move in a day. A reading like this means AstraZeneca can still travel meaningfully in either direction, but without the kind of erratic swings that usually accompany stress events.
Volume is less supportive. Last trade volume of 2,302,552 was only 0.8× normal versus the 20-session average of 2,761,731, while OBV is falling. OBV, or on-balance volume, tracks whether volume is flowing into or out of the stock. A declining OBV alongside a softer price usually means distribution is still in progress: more shares are being traded on down moves than on up moves. That weakens the case for an immediate recovery, because rallies built on light participation often fade quickly.
Key Levels & Scenarios
The near-term map is straightforward. 11,460.00 is the first level to watch on the downside, while 12,476.00 is the first clear ceiling on the upside. Between those two points, the stock is basically trapped in a band, and the current price sits much closer to the floor than the roof.
If 11,460.00 fails, the chart would be vulnerable to a deeper test of the lower volatility band at 11,495.83 and then the broader three-month low of 9,892.00. If price instead reclaims 11,968.50, that would mark a return to the Bollinger midline and the SMA20, which would be the first sign that the recent weakness is being absorbed. A move through 12,476.00 would matter more because it would clear the current resistance and suggest the squeeze is resolving upward.
Technical Verdict: HOLD (wait & see)
HOLD (wait & see)
- Price is below both the SMA20 at 11,968.50 and the SMA50 at 12,524.60, so the stock has not yet regained its trend anchors.
- MACD momentum is improving, but RSI at 43.4 and Stochastic at 27.4 / 44.3 still show only neutral-to-soft short-term conditions.
- Bollinger Bands are tight at 7.9%, which suggests a breakout may be building, but volume at 0.8× normal and falling OBV do not confirm it yet.
Verdict invalidated if price falls below 11,460.00.
- Ideal Entry Range: 11,460.00 to 11,968.50
- Exit Target: 12,476.00
- Stop Loss protection: below 11,460.00
For non-traders: the shares are sitting in a tight range, with signs of stabilization but not enough proof of a recovery yet.
The latest 3-month high for AstraZeneca on this chart is 15,126.00.
Summary Data AstraZeneca
| Last price | 11,650.00 GBp |
| Change 1 day / 5 days / 1 month | -3.26% / -2.61% / -2.84% |
| Trend / MA-cross | sideways / none |
| SMA20 / SMA50 | 11,968.50 / 12,524.60 |
| RSI (14) / Stochastic %K | 43.4 / 27.4 |
| Bollinger %B / ATR | 16% / 295.03 |
| Support / Resistance 20 days | 11,460.00 / 12,476.00 |
| Data as of | 8 September 2026 14:00 WIB |
Track AstraZeneca share price daily: live levels, support/resistance and our full AstraZeneca analysis history.



