BAC Stock Analysis: Gains 0.45%, Momentum Weakens
On September 10, 2026: price 62.67 USD, trend sideways, RSI 52.9, support 61.17, resistance 64.81. technical analysis of bac stock. BAC Stock Analysis — full…
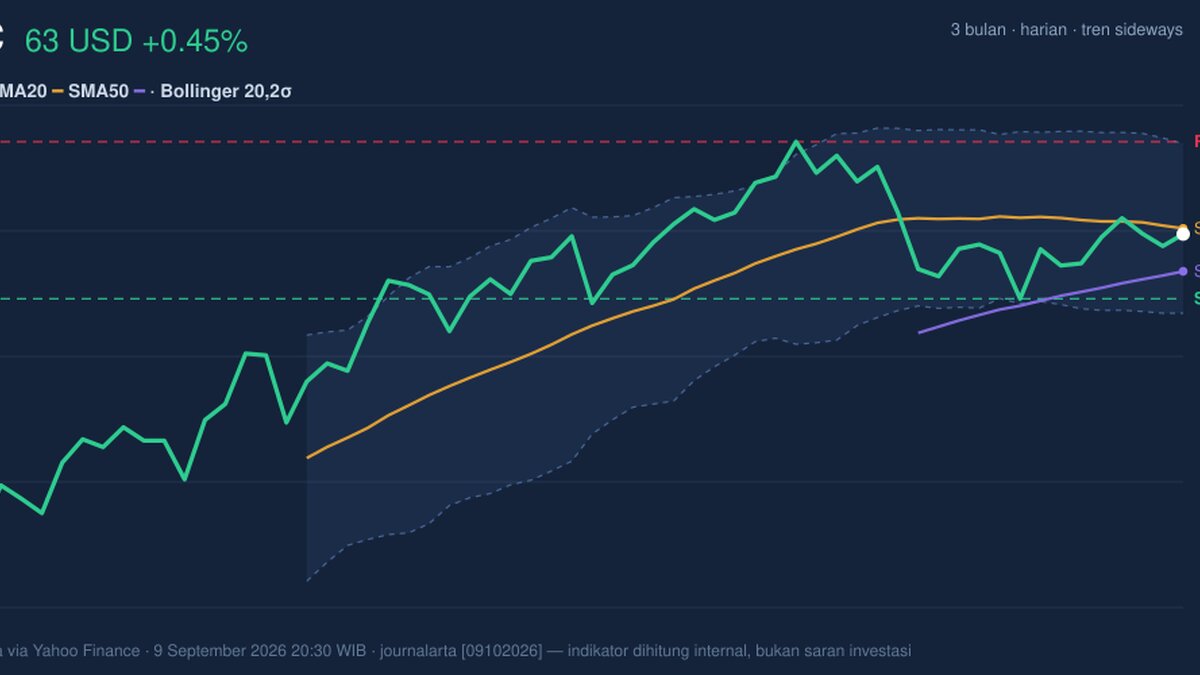
Bank of America is trading in a narrow band, and the signal for international investors is simple: the shares are holding up, but they have not yet proved that the latest bounce can turn into a stronger trend. On 9 September 2026 at 20:30 WIB, BAC last changed hands at 62.67 USD, up 0.45% on the day, yet still below the SMA20 at 62.80 and only modestly above the SMA50 at 61.81. That combination matters because it usually points to a market that is stabilising rather than accelerating.
Trend & Price Action
The broader structure remains sideways, with the SMA20 sloping down by -0.31% over 5 days. In plain terms, the short-term trend is still soft even though the longer moving average is below the current price, which keeps the chart from turning outright bearish. There is no new MA-cross, so the market has not produced the kind of moving-average confirmation that often marks a cleaner trend change.
As shown in the chart, BAC is trading in the lower half of its recent band, with the price at 41% of the 20-hour range. That positioning suggests buyers have defended the stock enough to avoid a breakdown, but they have not yet pushed it back into the upper part of the range where momentum usually strengthens. The 3-month high at 65.23 is close enough to matter, but the stock is still trading well above the 3-month low at 54.07, which keeps the medium-term base intact.
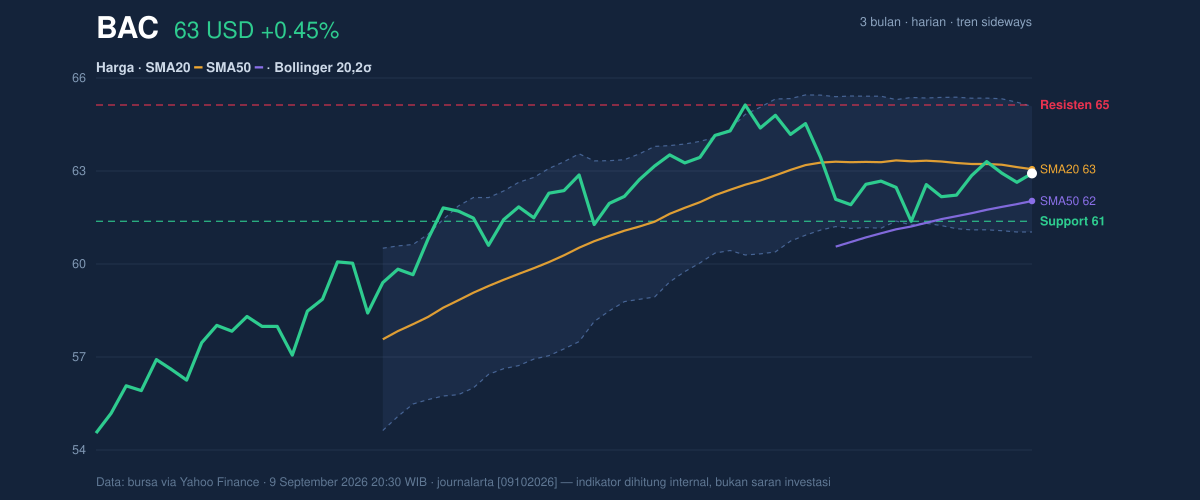
The key message from price structure is that BAC is coiling rather than trending. That can be constructive, but only if the market can reclaim nearby resistance and show that demand is broad enough to absorb supply above the short-term average.
Oscillators & Momentum
The momentum picture is mixed, and that is why the chart does not yet support a decisive directional call. The RSI at 52.9 is neutral, which means the stock is neither overbought nor oversold. In practical terms, RSI is telling us that BAC has room to move either way, but it is not currently stretched enough to imply urgency.
The Stochastic at 64.1 / 50.1 is also neutral, though it leans slightly firmer than RSI. Stochastic tends to react faster than RSI, so a reading above the midpoint often hints that short-term buyers are still active. But the more important signal here comes from the MACD at 0.153 versus signal 0.241, with a histogram of -0.088. That negative histogram means the faster line is still below the signal line, a classic sign that upward momentum is losing pace even if price has not rolled over sharply.
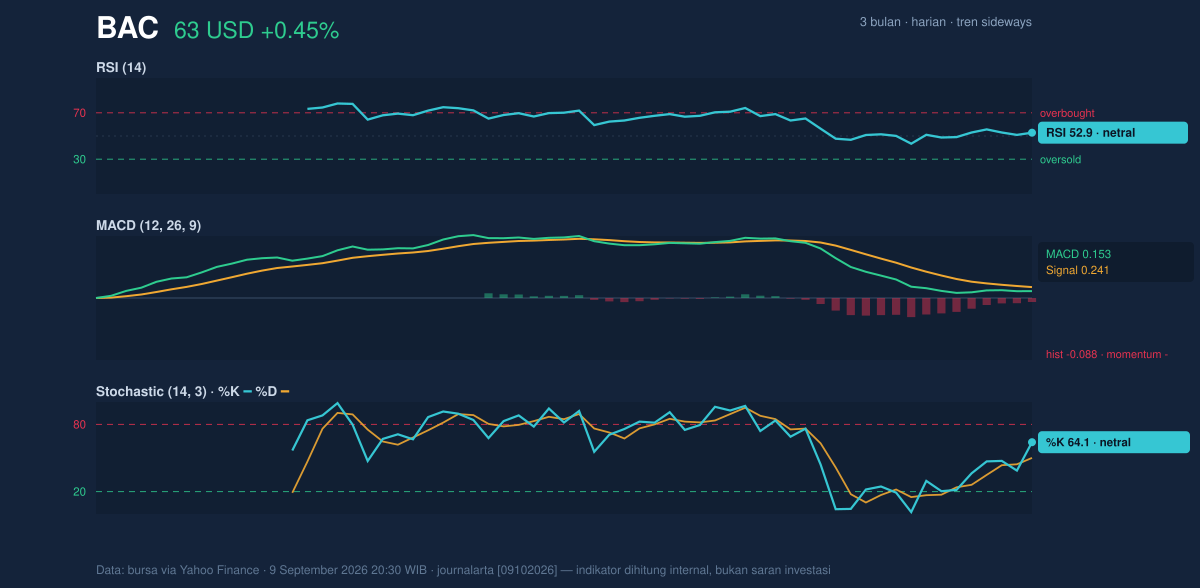
So while the oscillators are not warning of immediate weakness, they are not confirming an upside break either. The result is a market that looks balanced on the surface, but with momentum still slightly tilted against the bulls.
Volatility & Volume
Volatility is moderate rather than extreme. The ATR(14) at 1.11, or 1.8% of price, suggests normal daily movement for a large US bank. That matters because a stock with this profile can move enough to matter, but not so violently that every session changes the technical picture. More importantly, the Bollinger Band width of 6.3% is narrowing, which is a squeeze signal. In simple language, the market has become quieter, and quiet periods often precede a larger move once price escapes the band structure.
The current %B at 47% places BAC just below the middle of the Bollinger envelope, another sign of equilibrium rather than breakout. Price is not pressing the upper band at 64.77, but it is also not drifting toward the lower band at 60.84. That middle-ground positioning reinforces the sideways read.
Volume adds a subtle but important wrinkle. The latest trade volume of 36,015,200 is about 1.2× normal versus the 20-day average of 29,968,585, so the move was not a thinly traded bounce. Yet OBV is falling, and that matters because OBV tracks whether volume is flowing into the stock more consistently than it is flowing out. Falling OBV while price stabilises usually means rallies are being met by distribution, or at least that accumulation is not strong enough to confirm the price action.
Key Levels & Scenarios
The market’s immediate map is fairly clear. The first support sits at 61.17, while the first resistance is at 64.81. Those levels are close to the Bollinger boundaries, which makes them especially relevant because price has been compressing inside a relatively tight range. A move above resistance would not just be a higher print; it would suggest the squeeze is resolving upward and that BAC is ready to test the 64.77 upper band and the nearby 65.23 3-month high.
If instead the stock slips back through 61.17, the chart would likely lose its current balance and shift attention toward the lower Bollinger band at 60.84, with the SMA50 at 61.81 no longer providing support. That would be a meaningful change because it would show that the recent rebound failed to hold the mid-range floor.
Technical Verdict: HOLD (wait & see)
The technical setup is best described as a HOLD (wait & see) because the stock is stabilising, but the indicators do not yet line up for a clean directional break.
- MACD remains negative versus its signal line, so short-term momentum is still a touch weak.
- Price is below the SMA20, which keeps the short-term trend from turning fully constructive.
- Bollinger Bands are squeezing, meaning a larger move may be coming, but direction is not confirmed yet.
Verdict invalidated if price breaks below 61.17, because that would weaken the current range floor and raise the risk of a move toward the lower band.
- Ideal entry range: 61.17 to 62.80
- Exit target: 64.81 to 65.23
- Stop loss protection: below 60.84, with 61.17 as the nearer technical floor
In plain English, BAC looks steady but unfinished: the chart is waiting for price to prove whether this quiet period becomes a breakout or just another pause.
Summary Data BAC
| Last price | 62.67 USD |
| Change 1 day / 5 days / 1 month | 0.45% / 1.10% / -2.08% |
| Trend / MA-cross | sideways / none |
| SMA20 / SMA50 | 62.80 / 61.81 |
| RSI (14) / Stochastic %K | 52.9 / 64.1 |
| Bollinger %B / ATR | 47% / 1.11 |
| Support / Resistance 20 days | 61.17 / 64.81 |
| Data as of | 9 September 2026 20:30 WIB |
Track BAC stock price daily: live levels, support/resistance and our full BAC analysis history.



