BP Stock Gains 1.96% Today, Testing Key Resistance
On September 10, 2026: price 557.10 GBp, trend uptrend, RSI 59.2, support 514.50, resistance 552.20. technical analysis of bp stock. BP Stock Gains — full…
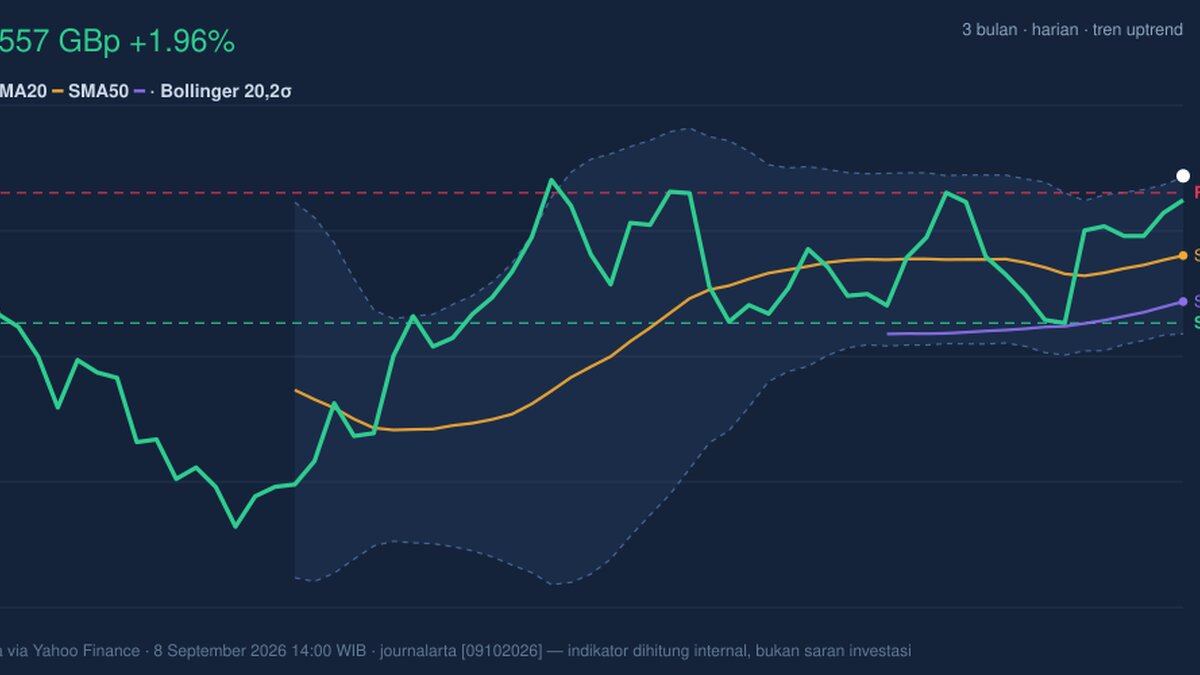
BP plc is pressing against the top of its recent trading band in London, but the signal from momentum is mixed: the shares are strong, yet participation has thinned. That matters because a move that runs ahead of volume can stall faster than the headline price suggests.
BP shares last changed hands at 557.10 GBp on the LSE, up 1.96% from the previous close of 546.40, and up 6.20% over the past month. The stock is now trading above both its short- and medium-term averages, a classic sign that the market is still rewarding the trend. But the more important question is whether this is a clean breakout or a stretched advance.
Trend & Price Action
The chart shows BP in an uptrend, with the SMA20 at 534.03 sitting above the SMA50 at 520.73. That alignment tells readers the recent pace of buying has been stronger than the broader intermediate trend. In plain language, the shares are not merely bouncing; they are holding above the levels traders often use to judge whether momentum is still intact.
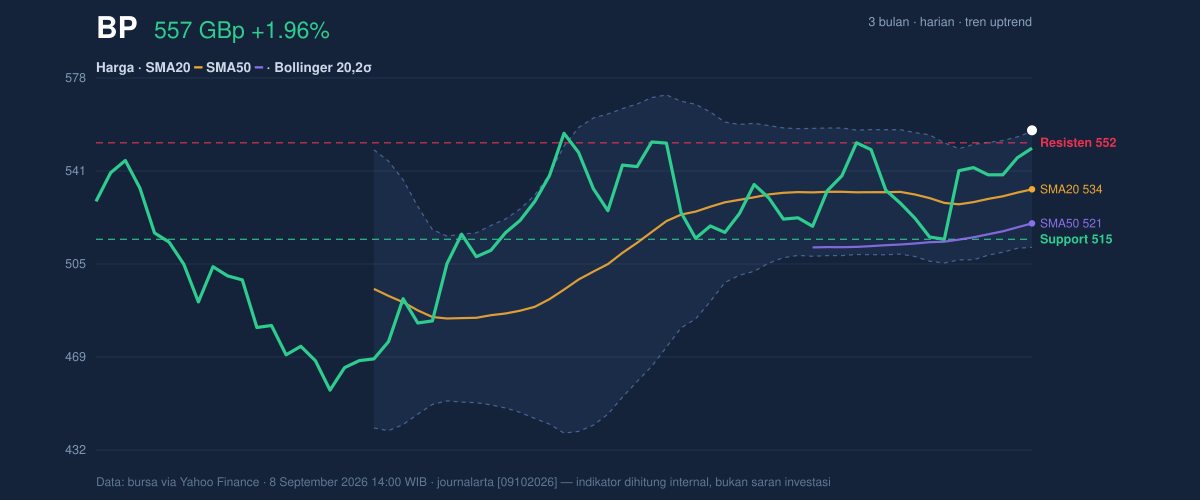
Price is also sitting just above the upper Bollinger Band at 556.68, while the middle band is 534.03 and the lower band is 511.38. A reading above 100% on %B, here 101%, means the stock is trading slightly beyond the upper band rather than comfortably inside it. That usually signals strength, but it can also mean the move is extended in the short term. The Bollinger band width of 8.5% is normal, so this is not a volatility squeeze that would typically precede a major expansion; instead, the market is already moving, and the question is whether it can keep doing so.
The nearest resistance on the 20-hour chart is 552.20, which BP has already pushed through, while the 20-hour support sits at 514.50. The stock is trading at 113% of that recent range, which is another way of saying it is near the upper end of the session structure. The 3-month high at 562.90 is now the next obvious reference point; that level matters because markets often pause or retreat near prior peaks as traders reassess whether the latest move has already priced in the good news.
Oscillators & Momentum
The momentum picture is constructive, but not cleanly so. The RSI(14) at 59.2 is still neutral, which means the stock is not yet in the classic overbought zone on that measure. By itself, that would suggest there is still room for the move to continue. However, the stochastic oscillator tells a more cautious story: %K at 81.3 and %D at 74.2 indicate an overbought condition. In practical terms, the stock has risen fast enough that short-term traders may already be crowded in, increasing the risk of a pause or a shallow pullback.
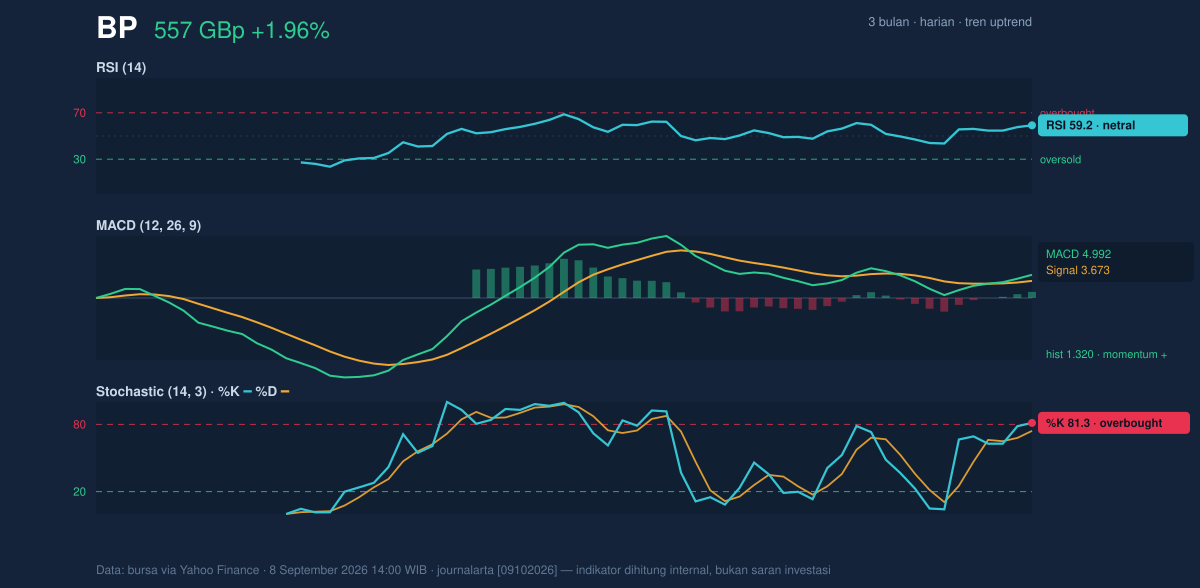
The MACD at 4.992, above its signal line at 3.673, with a positive histogram of 1.320, confirms that upside momentum is still present. MACD is useful because it measures whether recent price action is pulling away from its own trend baseline. Here it says the trend is still advancing, even if the stochastic suggests the move is becoming stretched. That combination often appears in late-stage advances: the trend remains positive, but short-term acceleration starts to outrun immediate buying power.
Volatility & Volume
Volatility is moderate rather than explosive. The ATR(14) at 15.86 equals 2.8% of price, which means BP can still move meaningfully in a day, but not in a disorderly way. For readers, ATR is a measure of typical daily movement; a 2.8% reading suggests the stock has enough range to test nearby levels without needing a major catalyst.
The more cautionary signal comes from participation. Last volume was 21,012,201, well below the 20-day average of 45,882,302, or about 0.5x normal. That is a clear sign that the latest rise is not being backed by broad trading activity. When price rises on lighter volume, it can still be valid, but the move has less evidence of widespread conviction. The OBV is down, which reinforces that concern: on-balance volume tracks whether volume is accumulating into strength or fading behind it. A falling OBV while price rises can signal that the rally is being led by price rather than by sustained demand.
Key Levels & Scenarios
The immediate technical map is fairly clear. Above the market, the key reference is the 3-month high at 562.90. A decisive push toward that area would show that BP is not just testing resistance but attempting to establish a new short-term high. Below the market, the first important support is the upper Bollinger band at 556.68, then the recent 552.20 resistance-turned-potential-support, followed by the SMA20 at 534.03. If price slips back below the moving average, the tone would shift from trend-following to consolidation. The deeper support to watch is 514.50, which would signal the recent advance has lost traction.
In scenario terms, holding above the upper band and above 552.20 keeps the chart constructive. Falling back below the SMA20 at 534.03 would suggest the breakout is failing to hold. A break under 514.50 would be a stronger sign that the recent rise has been unwound.
Technical Verdict: HOLD (wait & see)
HOLD (wait & see)
- MACD is positive, which supports the trend and shows upside momentum is still alive.
- Price is above the SMA20 and SMA50, confirming the broader structure remains bullish.
- Stochastic is overbought and volume is only 0.5x average, which weakens the quality of the latest push.
- Verdict invalidated if price falls below 534.03, the SMA20 and Bollinger midline.
- Ideal Entry Range: 534.03 to 552.20
- Exit Target: 562.90
- Stop Loss protection: 514.50
For non-traders, this means BP still looks technically strong, but the latest rise is stretched enough that the chart is asking for proof before it can be trusted further.
Summary Data BP
| Last price | 557.10 GBp |
| Change 1 day / 5 days / 1 month | 1.96% / 2.92% / 6.20% |
| Trend / MA-cross | uptrend / none |
| SMA20 / SMA50 | 534.03 / 520.73 |
| RSI (14) / Stochastic %K | 59.2 / 81.3 |
| Bollinger %B / ATR | 101% / 15.86 |
| Support / Resistance 20 days | 514.50 / 552.20 |
| Data as of | 8 September 2026 14:00 WIB |
Track BP share price daily: live levels, support/resistance and our full BP analysis history.



