CVX Testing Key Resistance: Stock Gains 1.91% (September 10, 2026)
On September 10, 2026: price 213.81 USD, trend uptrend, RSI 69.4, support 196.60, resistance 213.81. technical analysis of cvx stock. CVX Testing Key…
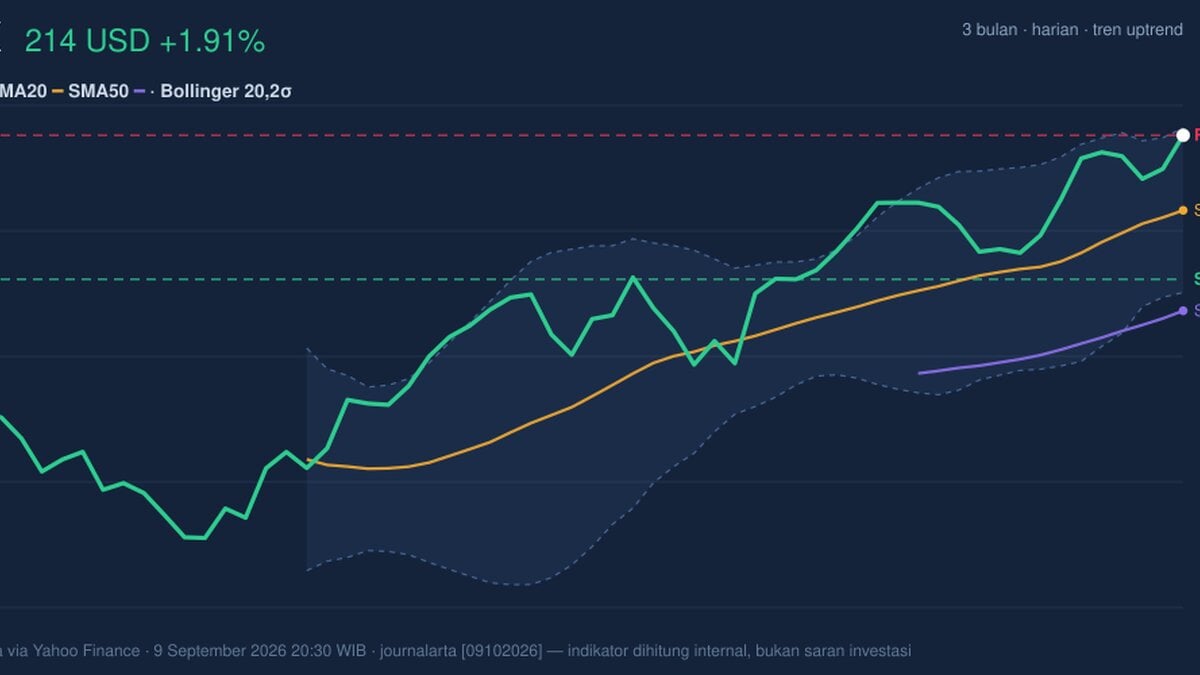
Chevron Corp. shares on the NYSE rose to 213.81 USD on 9 September 2026, adding 1.91% on the day and extending a 1-month gain of 8.72%, according to Yahoo Finance data. The move matters because it places the stock right at the top of its recent trading range, with price now pressing against the upper Bollinger band and the 3-month high, a setup that often signals either a breakout attempt or a pause as momentum traders take profits.
Trend & Price Action
The broader structure remains constructive. Chevron is trading above both its SMA20 at 204.84 and SMA50 at 192.83, which means the short-term trend is above the medium-term trend and the market is still rewarding buyers. The SMA20 slope of 2.54% over 5 days shows the nearer-term average is still rising, a sign that the recent advance is not just a one-day spike but part of an active uptrend. There is no fresh MA-cross, so the chart is not flashing a new trend regime; instead, it is showing an established uptrend that is being tested near resistance.
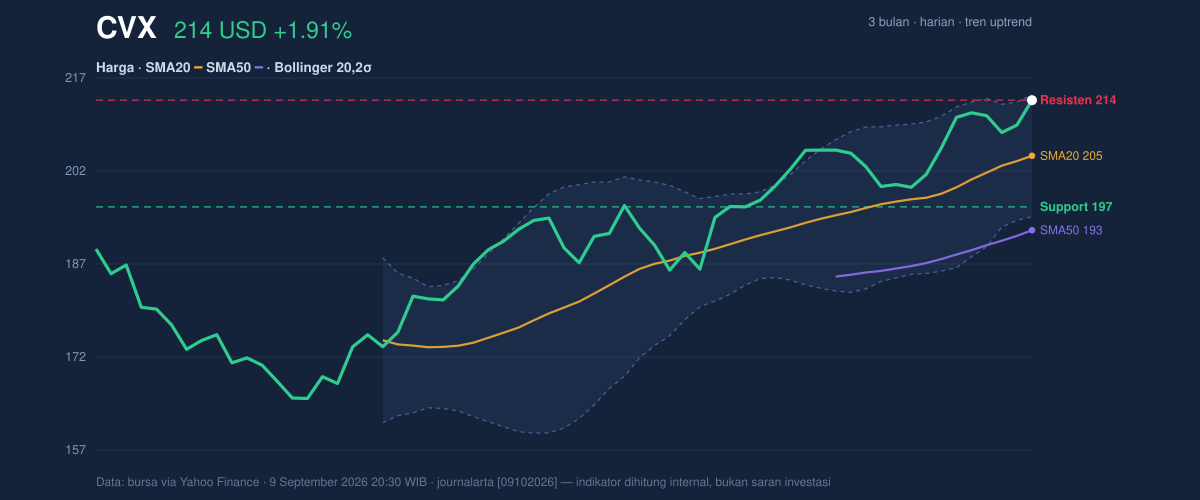
The key detail is where the price sits inside the range: the stock is at 100% of the 20-hour range, with 213.81 also matching the listed resistance, while the 3-month high stands at 215.28. That means Chevron is trading in the narrow zone where upside continuation becomes harder to prove without fresh demand.
That is the market’s test.
Oscillators & Momentum
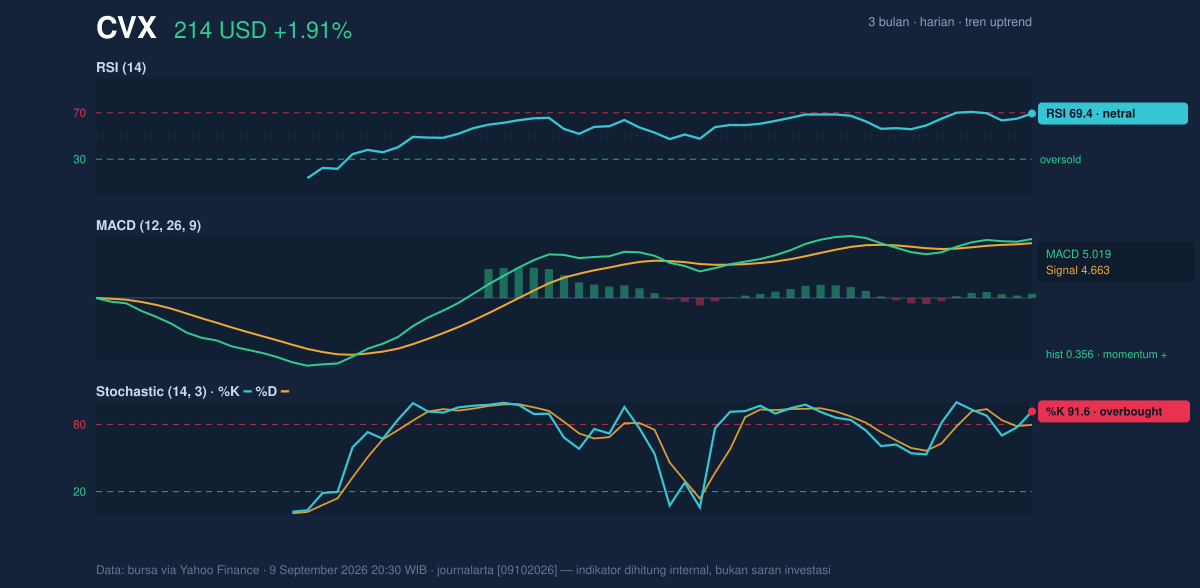
Momentum is still positive, but it is no longer cleanly aligned. The MACD at 5.019 sits above its signal line at 4.663, and the positive histogram of 0.356 shows buyers still have the upper hand in trend terms. In plain English, MACD says the recent rise is still supported by underlying momentum rather than being a purely mechanical bounce.
At the same time, the oscillator picture is getting stretched. The RSI at 69.4 is technically still in neutral territory, but it is close enough to the usual overbought threshold to suggest the stock is nearing a point where enthusiasm can cool. More importantly, the Stochastic %K at 91.6 and %D at 79.7 are both in overbought territory, which means the latest price is closing near the top of its recent range and has likely outrun short-term balance. That does not automatically mean reversal; it means the stock is more vulnerable to a stall if fresh buyers do not keep showing up.
In other words, trend support is still there, but the short-term rubber band is stretched.
Volatility & Volume
The Bollinger Band structure adds an important layer to the story. Chevron is sitting at %B of 96%, which means the price is near the top of the band envelope and very close to the upper boundary at 214.67. When a stock rides that high inside its band, it often reflects strong demand — but it also warns that much of the easy upside for the moment may already be reflected in price. The 9.6% band width is described as normal, so this is not a volatility squeeze waiting to explode; it is a regular-volatility advance that has moved to an elevated position.
ATR reinforces that interpretation. The ATR(14) of 3.88, equal to 1.8% of price, points to moderate day-to-day movement rather than a disorderly swing regime. That matters because moderate volatility near resistance often produces a slower, more tactical battle between continuation and consolidation.
Volume is supportive but not dramatic. The latest print of 8,384,700 shares is only about 1.1× the 20-day average of 7,611,555, which means the advance is being confirmed by participation, but not by a surge of urgency. The rising OBV — on-balance volume, a measure that tracks whether volume tends to accumulate on up days — suggests money flow is still leaning positive. Yet the absence of a volume blowout near resistance argues for caution: this is confirmation, not capitulation from sellers.
Key Levels & Scenarios
The market is now focused on a very tight band. Immediate support comes from the 20-hour support at 196.60, while the first technical ceiling is the current 213.81 resistance zone, followed by the upper Bollinger band at 214.67 and then the 3-month high at 215.28. Because the price is already at the top of the range, the next move matters more than the current level.
If Chevron can hold above the 204.84 SMA20 after any cooling-off phase, the trend remains intact and the chart would look more like consolidation than reversal. If it fails to stay above the current band top and slips back through the mid-band area around 204.84, that would suggest the rally is pausing rather than extending. A break below 196.60 would be more meaningful, because it would put the stock back into the lower half of its recent range and challenge the idea that buyers remain in control.
Technical Verdict: HOLD (wait & see)
HOLD (wait & see) fits the current setup best because Chevron is in an uptrend, but it is also pressing against resistance with Stochastic overbought and %B at 96%, which raises the odds of near-term hesitation. The MACD remains positive, so the trend is not broken, and the price above SMA20 and SMA50 keeps the larger structure constructive. Still, the stock is already at the top of its recent range, so the next move needs confirmation rather than assumption.
- Ideal Entry Range: 204.84 to 196.60, where price would be closer to the SMA20 and support
- Exit Target: 214.67 to 215.28, using the upper Bollinger band and 3-month high as the next technical ceiling
- Stop Loss protection: below 196.60, the listed 20-hour support
This means Chevron is still trending higher, but it is now close enough to resistance that the chart is asking for proof before the move can extend further.
Chevron’s next technical test is whether it can stay above 213.81 and challenge the 215.28 3-month high, with the market watching whether the latest volume and OBV support a clean break or a short pause.
Summary Data CVX
| Last price | 213.81 USD |
| Change 1 day / 5 days / 1 month | 1.91% / 1.31% / 8.72% |
| Trend / MA-cross | uptrend / none |
| SMA20 / SMA50 | 204.84 / 192.83 |
| RSI (14) / Stochastic %K | 69.4 / 91.6 |
| Bollinger %B / ATR | 96% / 3.88 |
| Support / Resistance 20 days | 196.60 / 213.81 |
| Data as of | 9 September 2026 20:30 WIB |
Track CVX stock price daily: live levels, support/resistance and our full CVX analysis history.



