INTC Stock Technicals Today: Gains 1.69%, Testing Key Resistance
On September 10, 2026: price 106.24 USD, trend sideways, RSI 63.7, support 87.26, resistance 106.24. technical analysis of intc stock. INTC Stock Technicals —…
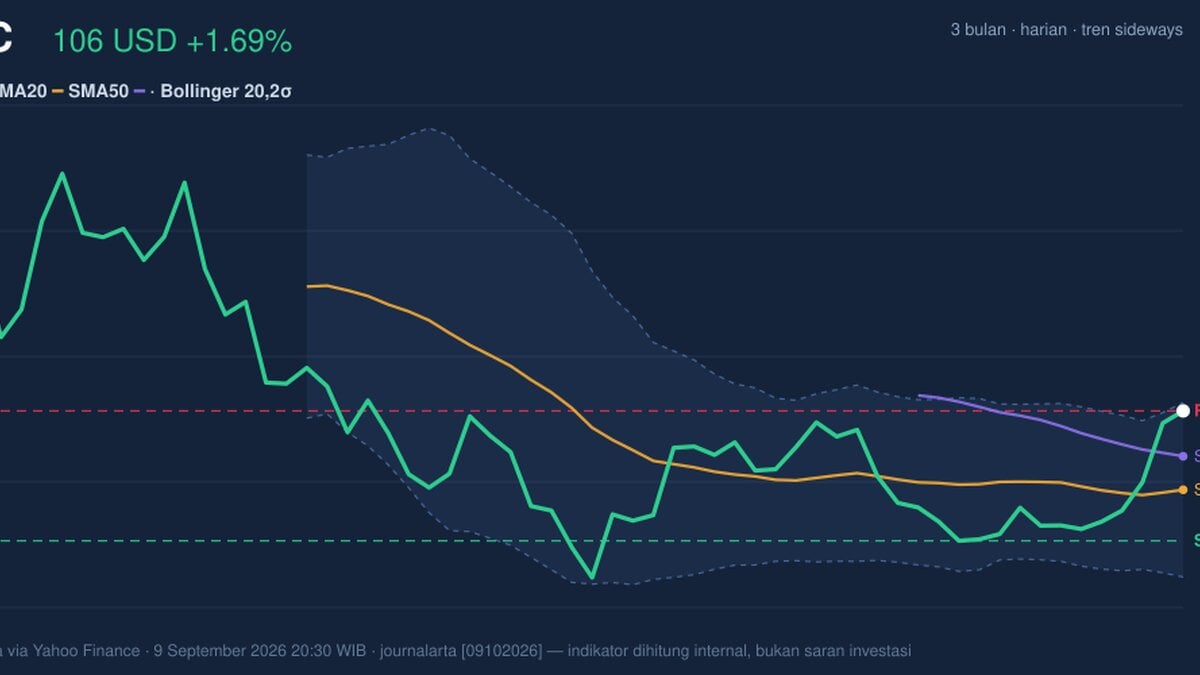
Intel’s latest move puts the stock at the top of its recent range, a sign that momentum is strong but also that the market is now testing how much enthusiasm is already priced in.
Intel closed at 106.24 USD, up 1.69% on the day, with a 5-day gain of 19.41% and a 1-month rise of 8.73%, according to data from Yahoo Finance via the exchange feed. That sharp short-term advance matters because it shows buyers have been willing to pay up quickly, not just drift higher over time. The catch is that the stock is now sitting right at the top of its 20-hour range, which usually means the next move depends less on the recent rally itself and more on whether fresh demand can absorb any profit-taking.
Trend & Price Action
The broader setup is still best described as sideways, even after the recent jump. The SMA20 at 94.72 and SMA50 at 99.62 both sit below the current price, so the stock has moved back above its shorter- and medium-term averages. That is constructive because it tells readers the rebound has already repaired some of the damage from earlier weakness. But the absence of a new MA-cross means there is no fresh moving-average confirmation to suggest a clean trend change yet.
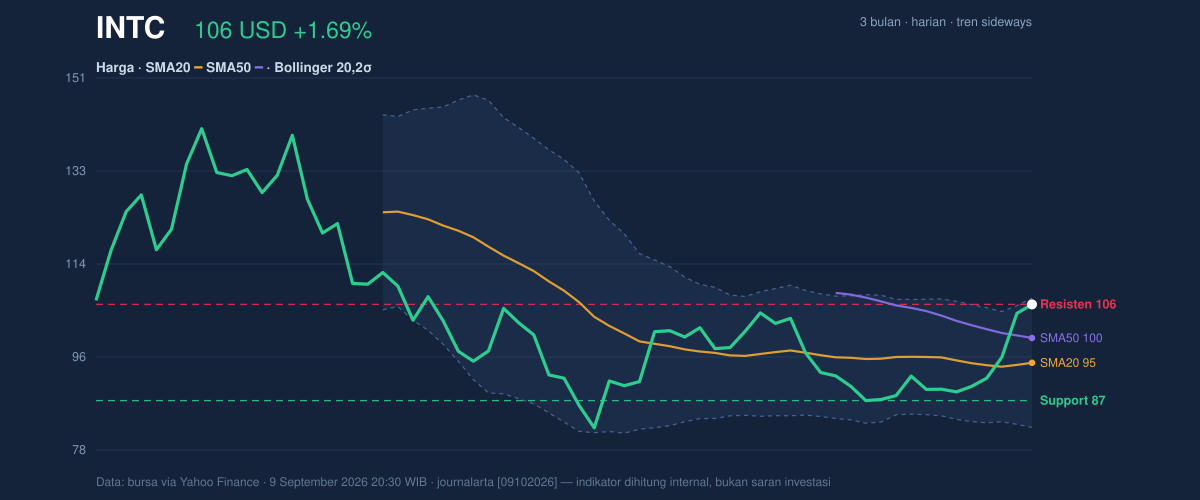
The chart also shows price pressed against the upper edge of the Bollinger band at 107.48, with %B at 95%. In plain language, that means Intel is trading very near the top of its recent statistical envelope, where rallies often become harder to extend without a pause. The Bollinger band width of 26.9% is widening, which signals expanding volatility rather than calm consolidation. When a stock is near the top of a widening band, the market is usually pricing in a larger move ahead, but not necessarily in one direction only.
The broader range context is equally important. Intel’s 3-month high is 142.35 and the 3-month low is 81.79, while the current price is also at the 100% point of the 20-hour range with support at 87.26 and resistance at 106.24. That placement suggests the stock has already reclaimed the upper boundary of its short-term trading corridor, leaving little room before it must either break higher or cool off.
Oscillators & Momentum
Momentum indicators are more mixed than the price action alone might suggest. The RSI at 63.7 is still described as neutral, which means momentum is firm but not yet at an extreme that automatically signals exhaustion. By contrast, the Stochastic %K at 97.9 and %D at 88.5 are clearly overbought, and that is the chart’s warning light. Stochastic measures how close price is to its recent high; readings this elevated often mean the stock has moved up fast enough that a pause, or even a pullback, becomes more likely.
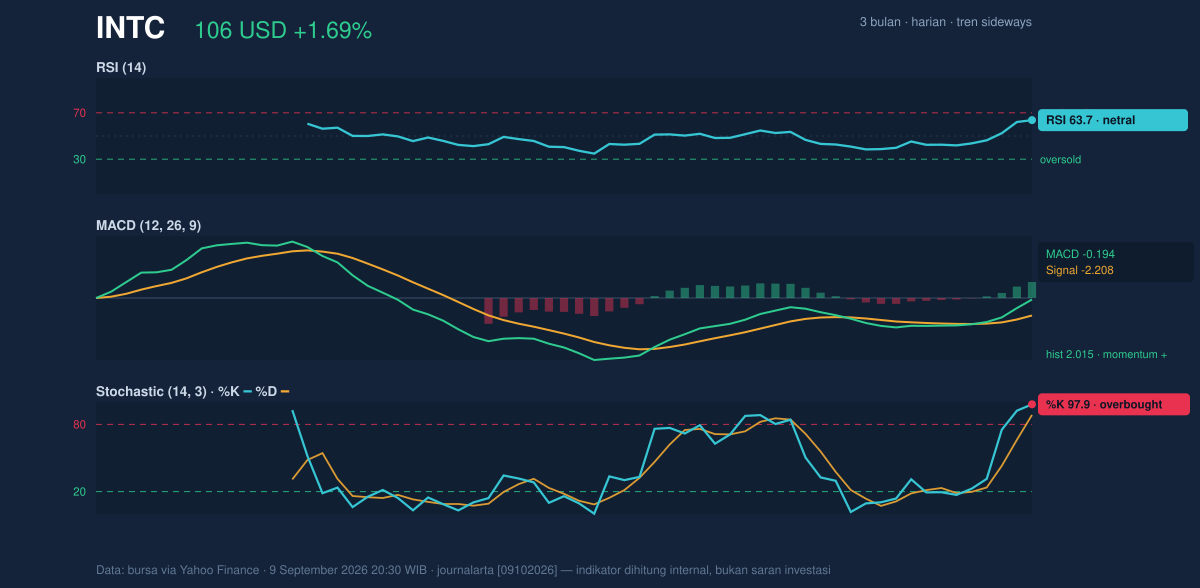
The MACD at -0.194, with a signal line at -2.208 and a histogram of 2.015, is positive in the sense that the histogram shows upside momentum is improving. That matters because MACD often turns before price does, and a positive histogram suggests the recent rally has internal support. Still, the fact that MACD remains slightly negative tells us the recovery is not fully proven on a longer momentum basis. In other words, the stock has enough thrust to keep moving, but not enough confirmation to remove doubt.
Volatility & Volume
Volume adds an important layer of credibility. The latest volume was 96,611,700, almost exactly in line with the 20-hour average of 96,462,940, or 1.0x normal. That is useful because the move higher was not driven by a thin, easily reversible burst of trading. At the same time, it was not backed by a dramatic volume surge, so the rally does not yet have the kind of broad participation that usually accompanies a decisive breakout.
The OBV is rising, which is a quiet but meaningful positive. OBV, or on-balance volume, tracks whether volume is accumulating on up days or distributing on down days. A rising OBV suggests more shares are changing hands in a way that supports the advance, even if the headline volume number itself is ordinary. The ATR at 4.19, equal to 3.9% of price, reinforces the idea that Intel is in a high-volatility phase. For readers, that means daily swings can be wider than usual, and nearby support or resistance levels can be tested quickly.
Key Levels & Scenarios
The immediate technical map is straightforward. Resistance sits at 106.24, which is effectively where the stock is trading now, while support is 87.26. Because price is already at resistance and near the upper Bollinger band, the market is in a decision zone rather than a comfortable trend channel.
If Intel can hold above the current level and keep momentum intact, the next technical reference is the 107.48 upper Bollinger band. A move through that area would indicate the stock is no longer just testing the top of its range but trying to expand beyond it. If it fails to sustain that push, the more likely response is a retreat toward the SMA20 at 94.72, which now acts as the first meaningful buffer below price. A deeper loss of that average would weaken the current rebound and bring the SMA50 at 99.62 back into focus as a secondary reference point.
Technical Verdict: HOLD (wait & see)
HOLD (wait & see)
- Stochastic is overbought at %K 97.9 and %D 88.5, which warns the recent rally may be stretched.
- MACD histogram is positive at 2.015, showing momentum is still improving, but the MACD line remains slightly negative at -0.194, so the trend is not fully confirmed.
- Price is at resistance at 106.24 and near the upper Bollinger band at 107.48, leaving limited room before the chart must prove itself again.
- Verdict invalidated if price falls below 94.72, the SMA20, because that would weaken the current rebound structure.
- Ideal Entry Range: 94.72 to 99.62
- Exit Target: 106.24 to 107.48
- Stop Loss protection: below 87.26
For non-traders, this means Intel is strong enough to watch closely, but stretched enough that the next move needs confirmation rather than assumption.
The latest close was 106.24 USD on 9 September 2026 at 20:30 WIB, with the stock ending exactly at its 20-hour resistance.
Summary Data INTC
| Last price | 106.24 USD |
| Change 1 day / 5 days / 1 month | 1.69% / 19.41% / 8.73% |
| Trend / MA-cross | sideways / none |
| SMA20 / SMA50 | 94.72 / 99.62 |
| RSI (14) / Stochastic %K | 63.7 / 97.9 |
| Bollinger %B / ATR | 95% / 4.19 |
| Support / Resistance 20 days | 87.26 / 106.24 |
| Data as of | 9 September 2026 20:30 WIB |
Track INTC stock price daily: live levels, support/resistance and our full INTC analysis history.



