JPM Stock Gains 0.34%, Testing Support Level In Focus
On September 10, 2026: price 354.71 USD, trend sideways, RSI 50.1, support 351.55, resistance 365.18. technical analysis of jpm stock. JPM Stock Gains — full…
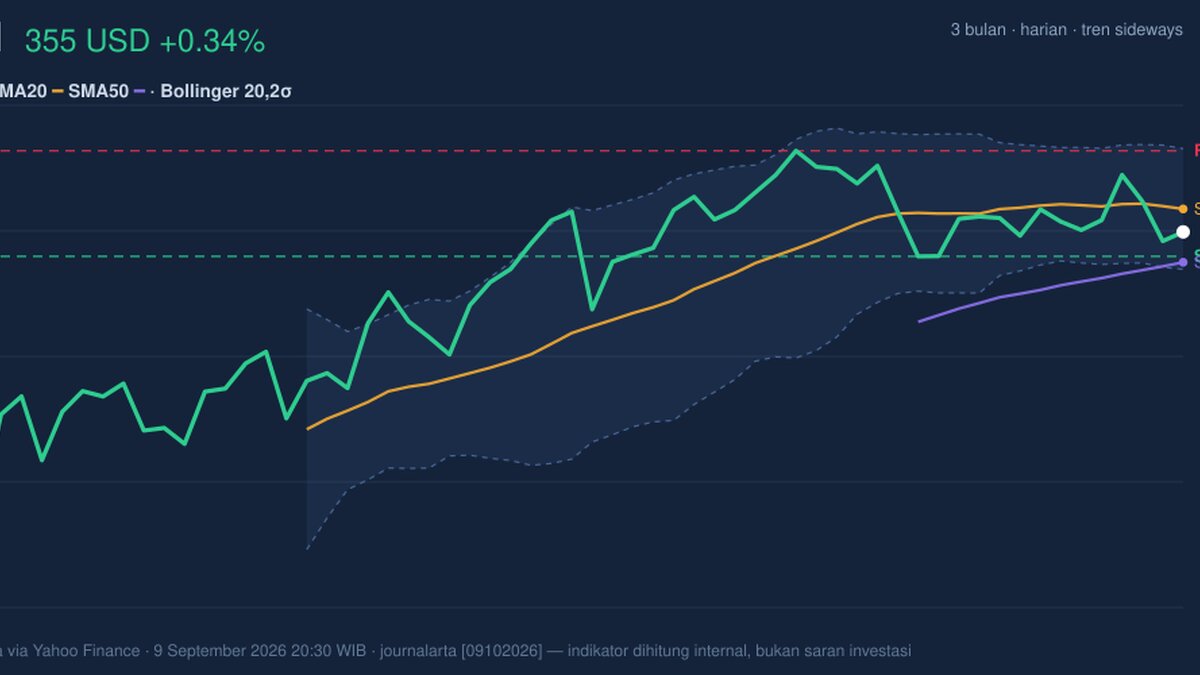
JPMorgan Chase (JPM) last traded at 354.71 USD on 9 September 2026 at 20:30 WIB, a modest 0.34% rise from the previous close of 353.51. The move looks small, but the chart is saying something more interesting: JPM is sitting in a narrow band just below its short-term average, with momentum cooling while volatility compresses. That combination often means the market is waiting for a catalyst rather than committing to a direction.
Trend & Price Action
As shown in the chart, JPM is still in a sideways trend, and the key detail is where price sits relative to the moving averages. The stock is trading below the SMA20 at 357.66 but above the SMA50 at 350.77. That placement matters because it shows the short-term tone is softer than the medium-term trend: buyers have not lost the longer structure, but they also have not reclaimed near-term control.
The SMA20 slope is -0.14% over 5 days, which is not a sharp decline, but it does signal a slight drift lower rather than a clean uptrend. There is no new MA-cross, so the chart lacks the kind of moving-average shift that would usually confirm a fresh trend change. In plain terms, JPM is not breaking down, but it is also not building enough upward pressure to clear the short-term ceiling.
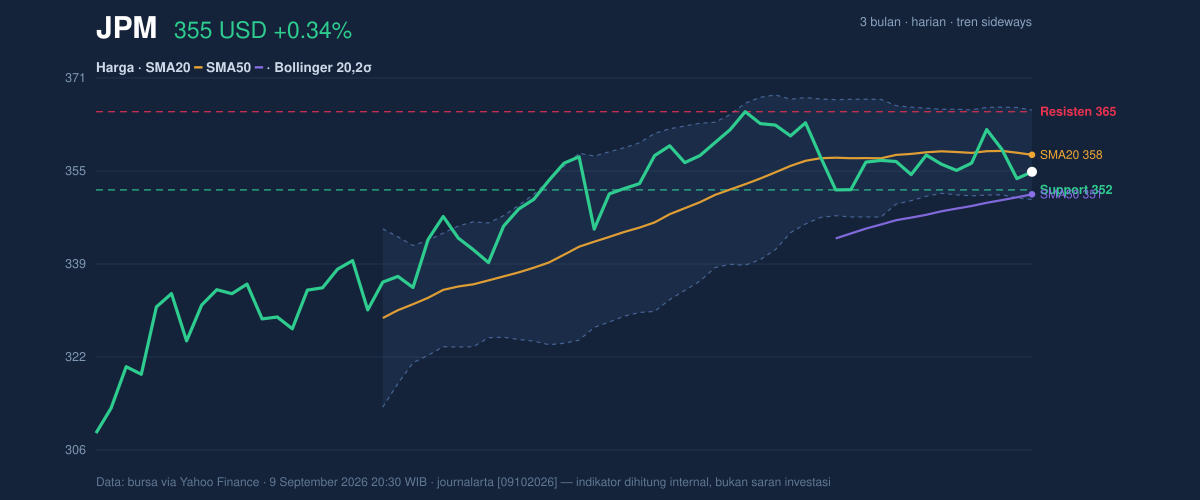
The broader range reinforces that reading. JPM is trading near the lower-middle portion of its recent band, with the current price at about 23% of the 20-hour support-resistance range. The 3-month high at 366.50 and low at 308.88 show there is room on both sides, but the stock is currently far from the upper end of that range. That means the market has not yet priced in a decisive re-rating; it is still digesting the last leg of movement.
Oscillators & Momentum
Momentum is neutral on the surface, but the deeper signals are less encouraging. The RSI(14) at 50.1 is almost exactly midline, which usually means neither buyers nor sellers have a clear edge. The Stochastic %K at 42.5 and %D at 43.3 also sit in neutral territory, showing price is not stretched enough to suggest an immediate reversal from overbought or oversold conditions.
What changes the tone is the MACD. With MACD at 1.309, signal at 2.167, and histogram at -0.858, the momentum line is below its signal line and the histogram is negative. That setup means recent price action has lost impulse even though the broader trend has not broken. It is a classic “not bearish enough to panic, but weak enough to hesitate” reading.
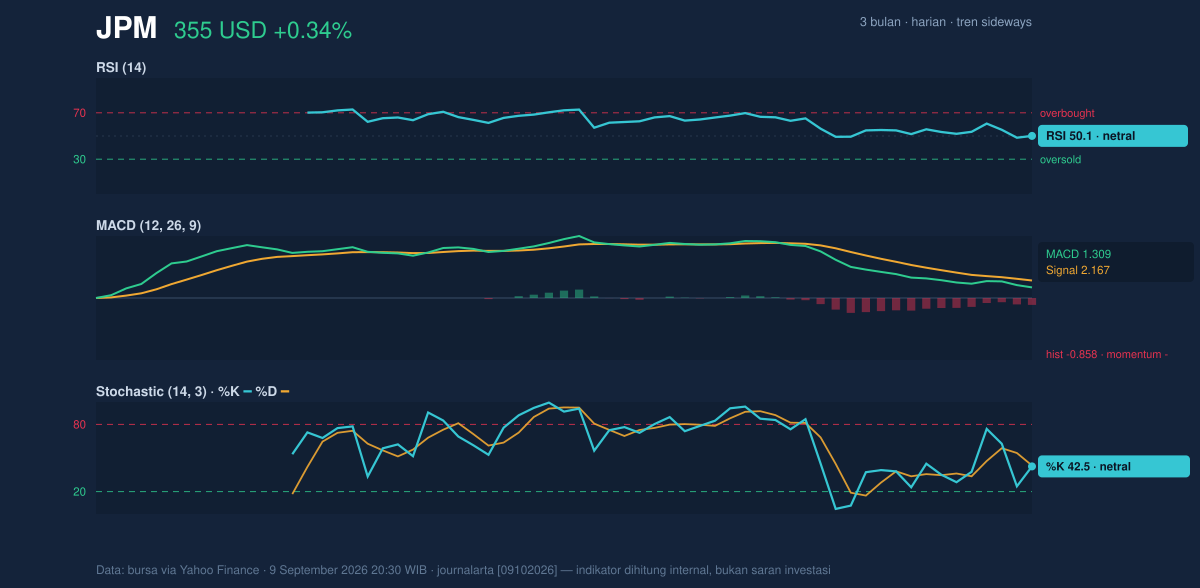
In practical terms, the oscillators are not confirming a downside break, but they are also not providing the thrust needed to push JPM cleanly through resistance. The chart is balanced, yet the momentum tilt is slightly negative.
Volatility & Volume
The volatility picture adds another layer. Bollinger Bands are relatively tight, with the upper band at 365.46, the middle band at 357.66, and the lower band at 349.87. The 4.4% band width is narrowing, which often signals a squeeze — a period when price movement is contracting before a larger directional move. That does not tell us direction by itself, but it does tell us the current calm may not last long.
The %B at 31% places price in the lower part of the band, not at an extreme, but below the midpoint. That usually means JPM is leaning toward the softer side of its short-term range without being oversold. The ATR(14) at 5.81, or 1.6% of price, indicates moderate daily movement. So while the band squeeze points to a potential expansion, the ATR suggests the stock is not yet in a high-stress volatility regime.
Volume last printed at 6,318,200, above the 20-hour average of 5,558,885, or about 1.1× normal. That is enough to say participation improved slightly, but not enough to call it a conviction breakout. More importantly, OBV is falling, which means the cumulative volume trend is not supporting price strength. In technical analysis, that divergence matters: a stock can rise on a day, but if OBV keeps slipping, the underlying buying pressure is not convincing.
Key Levels & Scenarios
The immediate map is clear. Support at 351.55 is the first line to watch, and it sits just above the SMA50 at 350.77 and the lower Bollinger band at 349.87. That cluster makes the low-350s an important zone: if it holds, JPM can continue to trade inside the current range; if it fails, the chart becomes more vulnerable to a deeper retracement.
On the upside, resistance at 365.18 sits just under the Bollinger upper band at 365.46 and near the 3-month high of 366.50. That is a meaningful ceiling because it marks the area where recent rallies have likely met supply. A move through that zone would matter not just because of the level itself, but because it would also imply the squeeze is resolving upward and the stock is reclaiming the upper half of its recent range.
Technical Verdict: HOLD (wait & see)
JPM is in a sideways setup with a slight bearish momentum bias, but no confirmed breakdown. The verdict leans to HOLD (wait & see) because:
- Price is below the SMA20 at 357.66, which shows near-term weakness, but it remains above the SMA50 at 350.77, so the medium-term structure is still intact.
- MACD is negative with the histogram at -0.858, indicating momentum has faded even though RSI at 50.1 and Stochastic at 42.5 / 43.3 are neutral.
- Bollinger Bands are squeezing at 4.4%, which suggests a breakout may be coming, but the direction is not confirmed by OBV, which is falling.
This verdict is invalidated if price breaks below 350.77.
- Ideal Entry Range: 351.55 to 357.66
- Exit Target (Target Price): 365.18 to 365.46
- Stop Loss protection: below 349.87, with 350.77 as the key structural warning level
For non-traders, that means JPM is not sending a strong directional signal yet; the chart is waiting for price to prove whether the next move is a rebound or a slip through support.
OBV is falling while volume runs at 1.1× normal.
Summary Data JPM
| Last price | 354.71 USD |
| Change 1 day / 5 days / 1 month | 0.34% / -0.07% / -2.02% |
| Trend / MA-cross | sideways / none |
| SMA20 / SMA50 | 357.66 / 350.77 |
| RSI (14) / Stochastic %K | 50.1 / 42.5 |
| Bollinger %B / ATR | 31% / 5.81 |
| Support / Resistance 20 days | 351.55 / 365.18 |
| Data as of | 9 September 2026 20:30 WIB |
Track JPM stock price daily: live levels, support/resistance and our full JPM analysis history.



