Shell Stock Gains 0.62%, Testing Key Resistance In Focus
On September 10, 2026: price 3,504.00 GBp, trend uptrend, RSI 65.5, support 3,288.00, resistance 3,500.50. technical analysis of shell stock.
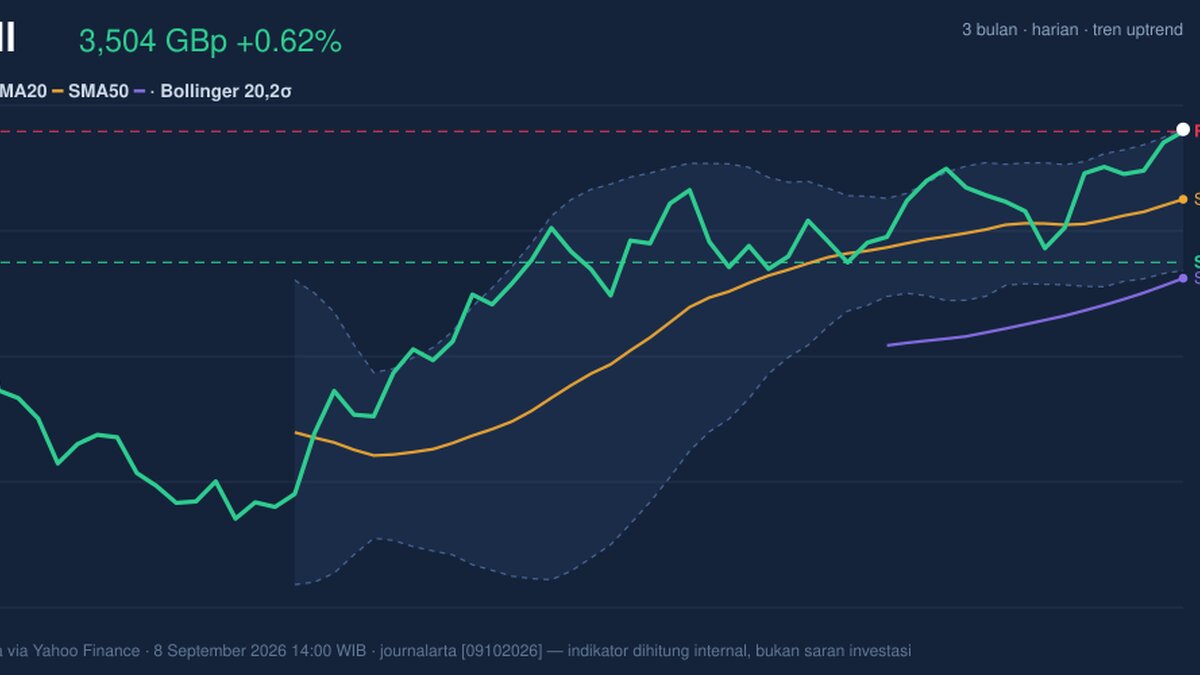
Shell plc edged higher on the London Stock Exchange to 3,504.00 GBp as of 8 September 2026 14:00 WIB, extending a short-term climb that has pushed the shares to the top of their recent trading band. The move matters because it is happening with the price now sitting just above a key ceiling, while momentum and trend signals are not fully aligned, which often marks the difference between a clean breakout and a pause.
Trend & Price Action
The shares remain in an uptrend, and that is visible in the way price is holding above both the SMA20 at 3,390.55 and the SMA50 at 3,262.44. In plain terms, the short-term average is above the longer average, and Shell is trading above both, which usually tells traders that recent buying has been strong enough to keep the larger trend intact. There is no fresh MA-cross, so this is not a new trend signal so much as a trend that has already been established and is still being tested.
The chart also shows the stock pressing right into the upper edge of its volatility envelope, with the upper Bollinger band at 3,505.90. That is important because prices near the top band often signal strength, but they can also signal exhaustion if buyers fail to extend the move. With the shares at 102% of the 20-hour range and near the 20-hour resistance at 3,500.50, the market is effectively asking whether Shell can convert resistance into support.
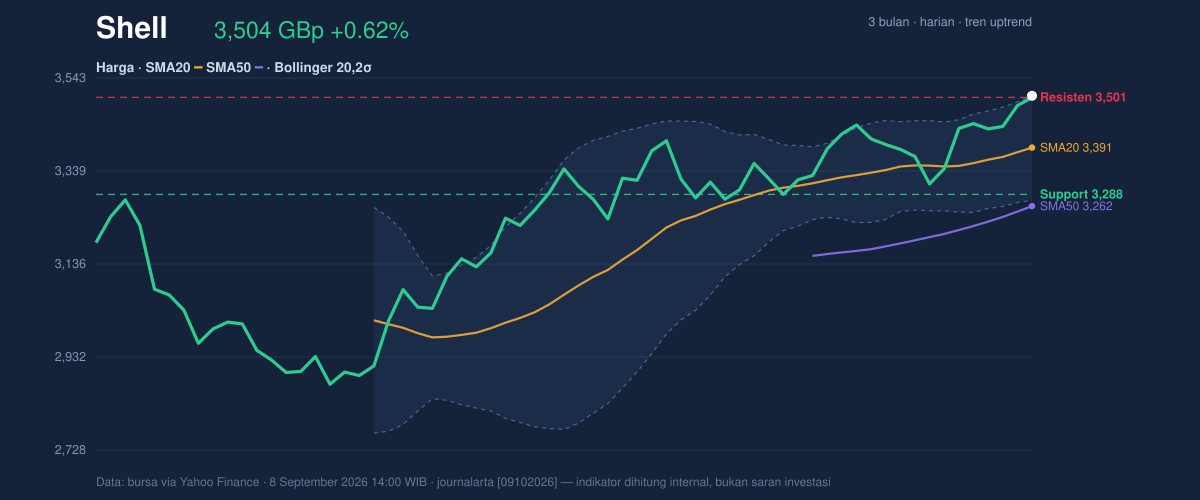
The broader frame is constructive. Shell is also close to its 3-month high of 3,525.50, far above the 3-month low of 2,559.50, which shows the market has already repriced the shares materially higher over the period. That said, the recent gain of 6.25% over one month and 2.08% over five days suggests the move is not a one-day spike; it is part of a sustained bid.
Oscillators & Momentum
The momentum picture is more mixed than the trend picture, and that is where the chart deserves attention. RSI at 65.5 is still technically neutral, but it sits close to the zone where enthusiasm starts to look stretched. In other words, buyers remain in control, yet the oscillator is no longer offering much room before the market begins to look overextended.
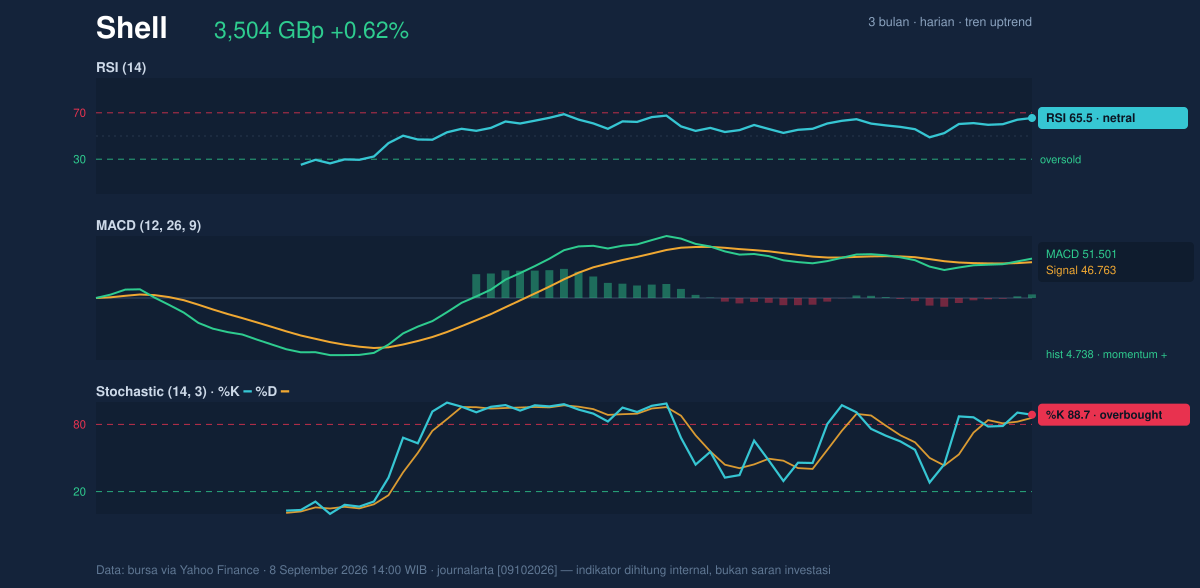
The Stochastic at 88.7 / 85.9 is more explicit: it is overbought. That does not mean the shares must fall, but it does mean the recent pace of gains has been fast enough that short-term traders may start locking in profits. The practical signal is that Shell can still rise from here, but the odds of a pause or a shallow pullback are higher than they were a few sessions ago.
The one indicator that keeps the bullish case alive is the MACD at 51.501 above the signal line at 46.763, with a positive histogram of 4.738. MACD measures trend momentum, so a positive spread like this means the upward move still has internal support. Put simply, price is stretched, but the trend engine is still running.
Volatility & Volume
Volatility is not especially aggressive right now. The ATR(14) of 53.15, equal to about 1.5% of price, points to moderate volatility, which usually means the market is moving with purpose but without panic. That matters near resistance: a moderate ATR suggests Shell may need fresh participation to break through, rather than simply drifting higher on inertia.
The Bollinger setup adds another layer. The band width of 6.8% is narrowing, which is often read as a squeeze. A squeeze does not predict direction, but it does suggest the market is compressing energy and may be preparing for a larger move. Because price is already hugging the upper band, the next expansion would likely be judged by whether Shell can clear resistance cleanly or slip back toward the middle band at 3,390.55.
Volume does not yet confirm a decisive breakout. Last volume was 6,583,211, well below the 20-session average of 10,360,425, or about 0.6× normal. That is a caution flag: price is advancing, but it is doing so without strong turnover. The encouraging counterpoint is that OBV is rising, which means the cumulative volume trend still supports the price advance. In short, participation is not booming, but the balance of traded flow remains constructive.
Key Levels & Scenarios
The nearest technical floor is the 20-hour support at 3,288.00. That level matters because it sits below the moving averages and would likely be the first place buyers try to defend if momentum cools. Above, the immediate barrier is the 20-hour resistance at 3,500.50, closely matched by the upper Bollinger band at 3,505.90. A clean move through that zone would signal that the market is willing to accept Shell at a new short-term high rather than just probing it.
If Shell breaks above 3,505.90 with volume improving, the chart would be pointing toward a continuation attempt into the area around the 3-month high of 3,525.50. If it fails to hold 3,500.50, the more likely reaction is a retreat toward the Bollinger midline at 3,390.55, where the trend would be tested again. A deeper slip through 3,288.00 would weaken the current structure and challenge the case that the breakout setup is still intact.
Technical Verdict: HOLD (wait & see)
HOLD (wait & see) fits the current setup because the trend remains positive, but the stock is also stretched near resistance and the short-term oscillators are overheated.
- MACD is positive, so trend momentum still supports the advance.
- Stochastic is overbought, which raises the risk of a pause or pullback near resistance.
- Price is at the upper Bollinger band and just under 3,500.50, so confirmation is still needed.
Verdict invalidated if price falls below 3,288.00.
- Ideal Entry Range: 3,390.55 to 3,288.00
- Exit Target: 3,505.90 to 3,525.50
- Stop Loss: below 3,288.00
For non-traders: Shell is still in a healthy uptrend, but it is close enough to resistance that the next move needs proof, not just momentum.
“We are close to the line where strength either becomes a breakout or fades into hesitation.”
Summary Data Shell
| Last price | 3,504.00 GBp |
| Change 1 day / 5 days / 1 month | 0.62% / 2.08% / 6.25% |
| Trend / MA-cross | uptrend / none |
| SMA20 / SMA50 | 3,390.55 / 3,262.44 |
| RSI (14) / Stochastic %K | 65.5 / 88.7 |
| Bollinger %B / ATR | 99% / 53.15 |
| Support / Resistance 20 days | 3,288.00 / 3,500.50 |
| Data as of | 8 September 2026 14:00 WIB |
Track Shell share price daily: live levels, support/resistance and our full Shell analysis history.



