Tencent Stock Technicals Today: Drops 0.32%, Testing Support Level
On September 10, 2026: price 434.00 HKD, trend downtrend, RSI 41.4, support 433.00, resistance 457.00. technical analysis of tencent stock.
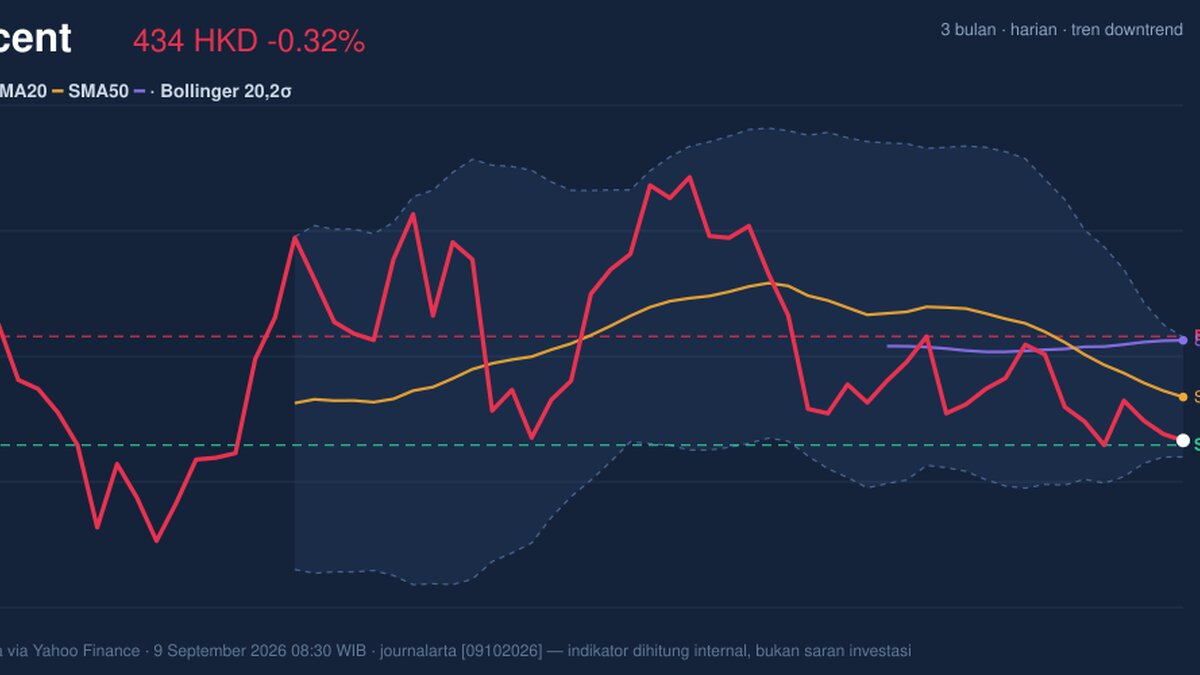
Tencent Holdings slipped on the Hong Kong exchange on 9 September 2026, with 0700.HK last at HKD 434.00, down from the previous close of 435.40, as the chart shows the stock still trading below its short- and medium-term trend lines. The move matters less for the size of the daily drop than for what it says about positioning: Tencent is sitting in a downtrend, but it is also pressing into an area where selling pressure has started to look stretched, especially with stochastic in oversold territory and the Bollinger band structure narrowing. That combination often means the market is not yet trending higher, but it is getting closer to a point where a sharp reaction can emerge either way.
Trend & Price Action
The price structure remains weak. Tencent is trading below the SMA20 at 443.60 and well under the SMA50 at 456.13, which tells readers the stock has not yet reclaimed even the short-term average cost base of recent buyers. The SMA20 slope is -2.08% over 5 days, a clean signal that the near-term trend is still pointing lower rather than flattening out. There is no fresh MA-cross, so the chart does not yet show a technical turning point in moving averages. Instead, the market is still digesting a month of weakness, with the stock down 5.98% over 1 month and only modestly above the 3-month low of 411.00. As shown in the chart, price is now close to the lower end of its recent range, which usually shifts attention from trend-following to defense of support.
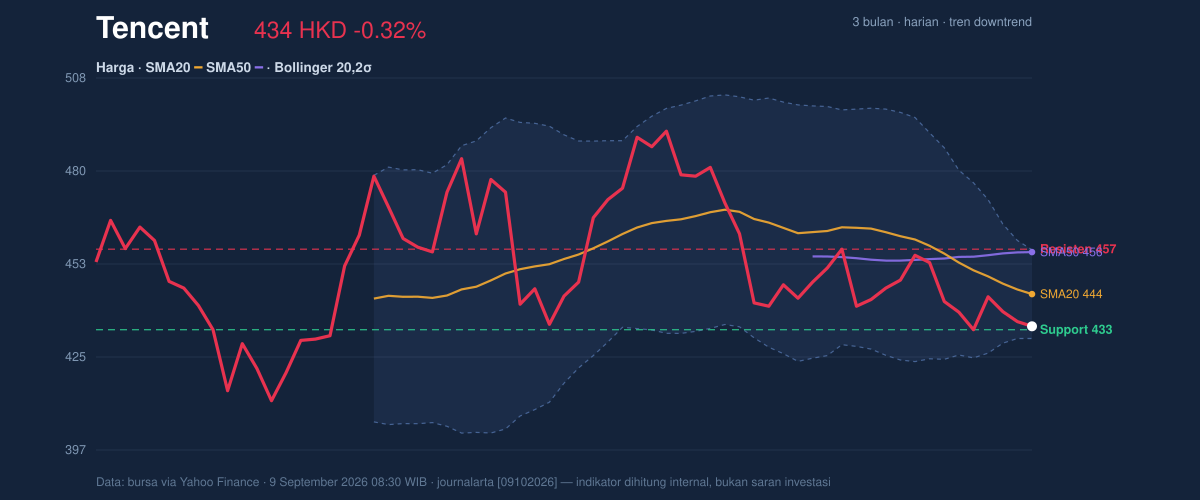
The immediate question is whether the current area can act as a floor or merely a pause before another leg lower.
Oscillators & Momentum
Momentum is mixed, and that is the most important nuance here. The RSI(14) at 41.4 is still neutral, meaning Tencent is not yet in a classic rebound setup based on RSI alone. But the Stochastic %K at 4.1 and %D at 10.3 is firmly oversold, which signals the stock is trading near the low end of its recent range and may be vulnerable to a short-term bounce if sellers lose control. At the same time, the MACD at -5.934 remains below the signal line at -4.859, with a histogram of -1.075. That is not a recovery signal; it says downside momentum is still in place, even if it is not accelerating aggressively.
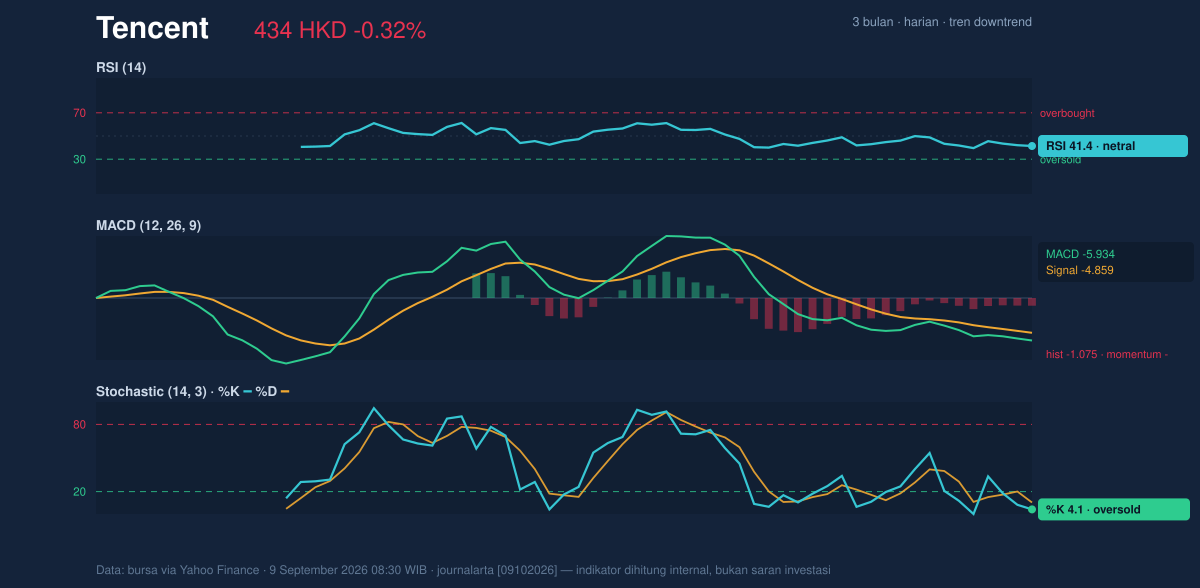
In plain English: Tencent looks tired, but not yet healed. Oversold stochastic can mark a rebound zone, yet the negative MACD warns that any bounce still has to prove itself.
Volatility & Volume
The volatility backdrop is interesting because it suggests a larger move may be building. The Bollinger Bands are narrowing, with band width at 6.0%, which is typically a squeeze condition. A squeeze does not tell direction, but it often precedes expansion, meaning the next decisive move can be sharper than recent daily changes. Tencent is also trading at a %B of 14%, near the lower band at 430.37. That placement shows price is hugging the lower part of its volatility envelope, consistent with weakness but also with the possibility of mean reversion if support holds.
Volume does not yet confirm conviction. The latest volume of 17,643,957 is only 0.8× normal versus the 20-day average of 21,979,437, and OBV is falling. In technical terms, that means the recent slide has not been met with strong accumulation. Sellers remain in control, but not with the kind of heavy turnover that usually marks a panic low. That leaves the door open for a test of support rather than a clean capitulation.
Key Levels & Scenarios
The level that matters first is support at 433.00. Tencent closed just above it at 434.00, so the market is effectively sitting on the edge of a short-term support test. If that area holds, the chart could attempt a rebound toward the nearest overhead barrier at 457.00, which also sits near the SMA50 at 456.13 and the upper Bollinger band at 456.83. That cluster matters because it is where trend followers and sellers are likely to reappear.
If support fails, the chart opens the door toward the lower Bollinger band at 430.37 and then the broader 3-month low zone near 411.00. The stock is currently about 4% into its 20-hour range, which suggests there is room for either direction, but not much comfort in between. The market is waiting for a break in one direction or the other.
Technical Verdict: HOLD (wait & see)
Tencent’s setup is best read as HOLD (wait & see) because the chart is still in a downtrend, yet short-term oversold signals are starting to argue for a reaction rather than a clean continuation.
- MACD remains negative, so downside momentum has not fully reset.
- Stochastic is oversold, which raises the odds of a bounce, but not a confirmed reversal.
- Bollinger bands are squeezing, suggesting a larger move may be near, but direction is still unclear.
Verdict invalidated if price falls below 433.00, because that would mean immediate support has failed and the lower band/low-zone scenario is taking over.
- Ideal Entry Range: HKD 430.37 to 434.00
- Exit Target: HKD 456.13 to 457.00
- Stop Loss protection: HKD 430.37 or, more conservatively, a decisive break below 433.00
For non-traders, this means Tencent is not showing a clean recovery yet, but it is close enough to support that the next move could become more pronounced if the floor gives way or starts to hold. “This is the kind of chart where patience is cheaper than guessing,” one Hong Kong trader said, “because the next break could be the real story.”
Summary Data Tencent
| Last price | 434.00 HKD |
| Change 1 day / 5 days / 1 month | -0.32% / -0.96% / -5.98% |
| Trend / MA-cross | downtrend / none |
| SMA20 / SMA50 | 443.60 / 456.13 |
| RSI (14) / Stochastic %K | 41.4 / 4.1 |
| Bollinger %B / ATR | 14% / 10.13 |
| Support / Resistance 20 days | 433.00 / 457.00 |
| Data as of | 9 September 2026 08:30 WIB |
Track Tencent share price daily: live levels, support/resistance and our full Tencent analysis history.



