Testing Key Resistance, AMD Stock Gains 3.04% Today
On September 10, 2026: price 521.10 USD, trend sideways, RSI 60.7, support 456.16, resistance 521.10. technical analysis of amd stock. Testing Key Resistance —…
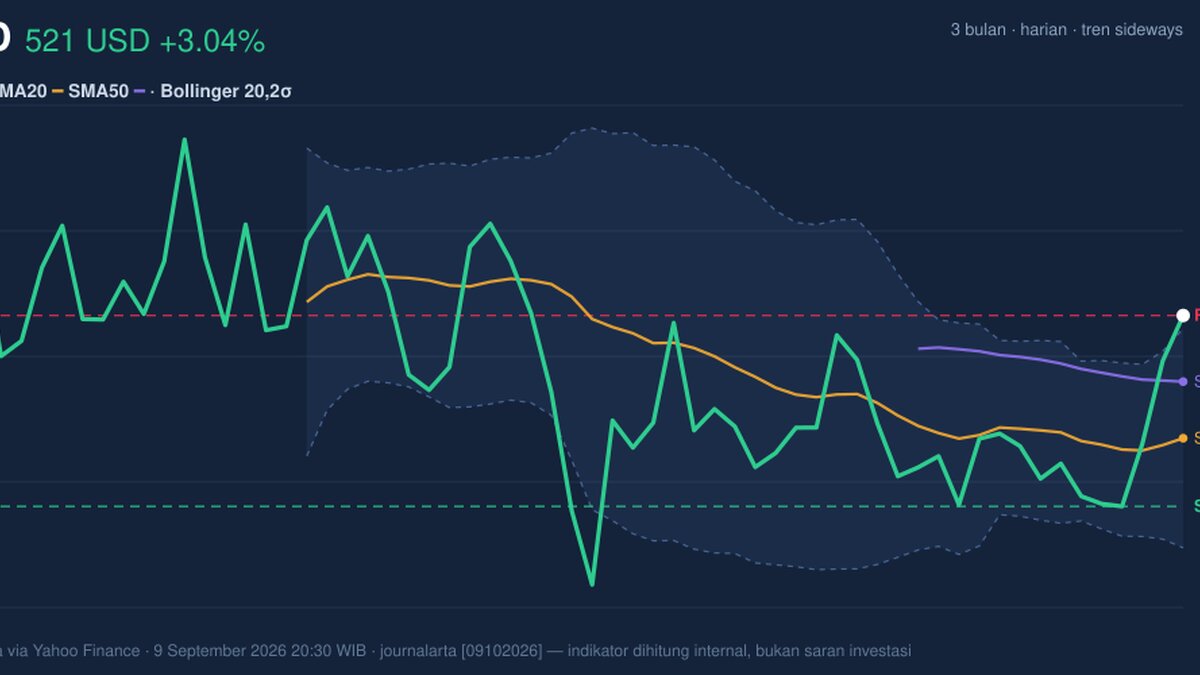
International investors are watching AMD at a point where momentum is strong, but the chart is also flashing signs of strain after a sharp run higher.
Advanced Micro Devices, Inc. climbed to US$521.10 on Nasdaq, up 3.04% from the previous close of US$505.74, extending a 13.38% gain over five days and a 9.86% rise over one month, according to exchange-linked market data via Yahoo Finance. The move matters because it has pushed the shares to the top of their recent trading band, where strength can either turn into a breakout or fade into consolidation.
Trend & Price Action
The broader pattern is still described as sideways, but that label hides an important detail: the stock is trading above both its short- and medium-term trend gauges. AMD is above the SMA20 at US$479.35 and also above the SMA50 at US$498.59, which tells investors that recent buying has been strong enough to lift the price back over both averages. In plain language, that is usually a sign that sellers have lost control in the near term.
What keeps this from becoming a clean trend story is the lack of a fresh moving-average crossover. A new “golden cross” or “death cross” often marks a more decisive shift in sentiment; here, the absence of one suggests the market is still sorting out whether the latest advance is the start of a larger leg higher or just a fast bounce within a broad range.
The chart also shows price pressing against the upper edge of the Bollinger band at US$516.61. Since AMD is now above that level, the move is technically extended in the short run. That does not automatically mean reversal, but it does mean the market is paying a premium for urgency, and urgency often comes with sharper two-way trading.
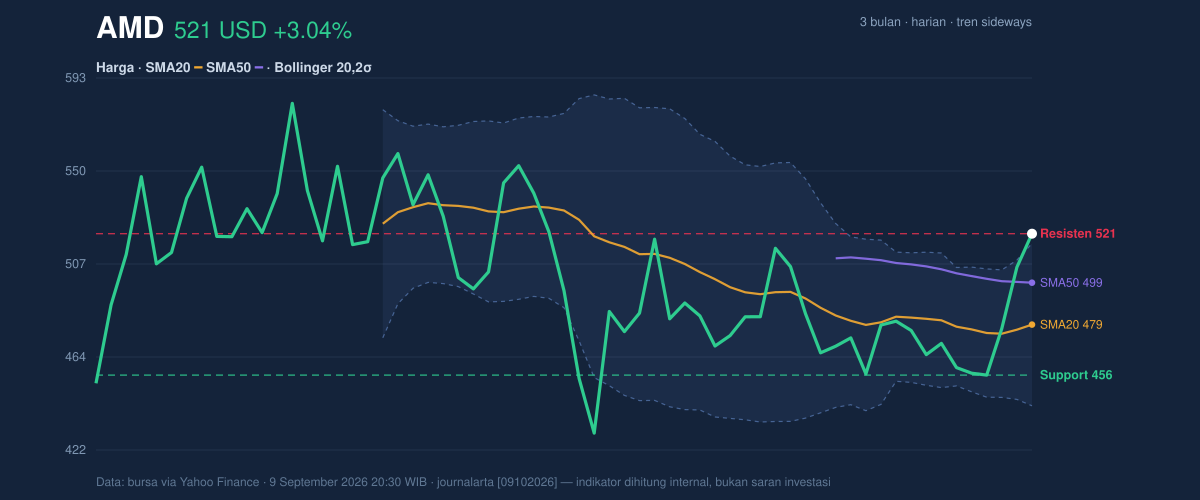
The stock is also sitting at the top of its 20-hour range, with support at US$456.16 and resistance at US$521.10. That positioning is important: when a share is at 100% of its recent range, traders are no longer asking whether it is recovering, but whether there is enough demand to keep pushing it into new territory.
Oscillators & Momentum
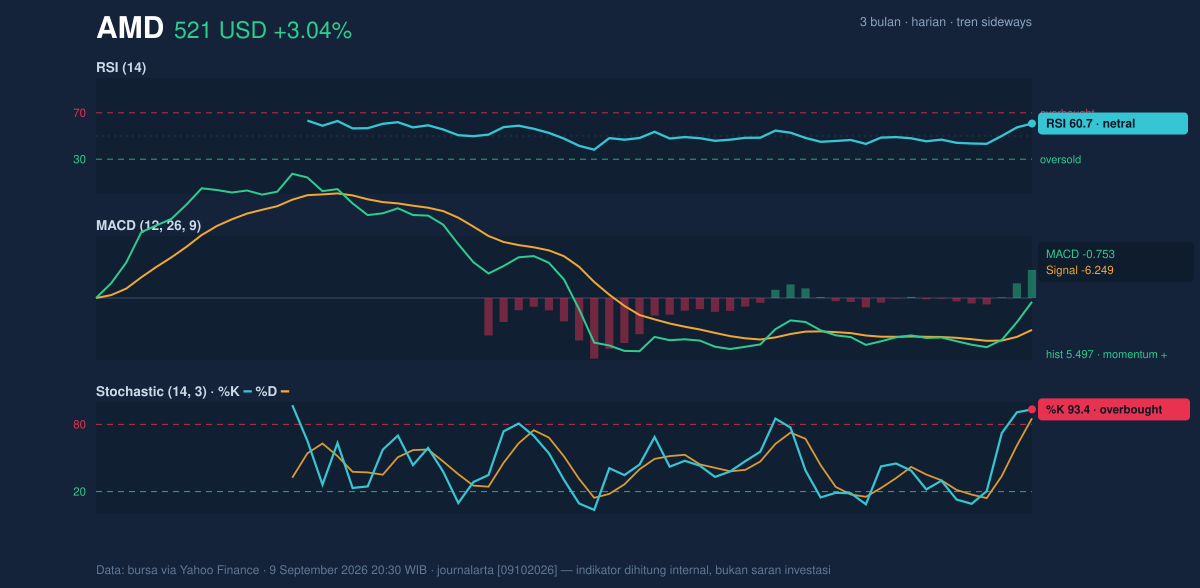
Momentum indicators are mixed in a way that often appears near short-term turning points. The RSI at 60.7 is still neutral, which means the stock is not yet in the kind of overheated zone that usually forces an immediate pullback. But the Stochastic reading of 93.4 / 85.5 is overbought, and that matters because stochastic tends to react faster than RSI. In practical terms, it says the latest rally has moved ahead of itself, even if the broader momentum picture has not fully cracked.
The MACD at -0.753 with a signal line at -6.249 and a positive histogram of 5.497 is more constructive. The histogram turning positive means the gap between price momentum and its signal has improved, which usually confirms that buyers are still active. Yet the fact that the MACD line remains below zero shows the market has not fully escaped the earlier weakness; momentum is improving, but not cleanly reset.
That combination — neutral RSI, overbought stochastic, and positive MACD histogram — often describes a stock that is strong but stretched. It can continue rising, but the next move is more likely to be choppy than smooth.
Volatility & Volume
Volatility is not low. ATR(14) is 18.50, or 3.6% of price, which means AMD can move quickly even on ordinary sessions. For readers outside the trading world, ATR is a measure of how much a stock typically swings; a higher reading means wider daily moves and a greater chance that stops and targets get tested quickly.
The Bollinger band width of 15.5% is described as normal, so the market is not in an extreme squeeze that would usually precede a dramatic release of pressure. Instead, the message is more nuanced: the stock is moving with enough force to stay above the upper band, but the surrounding volatility structure has not yet signaled a full-scale expansion.
Volume adds confirmation. Last volume was 22,104,300, above the 20-hour average of 18,133,670, or about 1.2× normal. That is not euphoric participation, but it is enough to show the rally is being backed by real trading rather than a thin, illiquid move. OBV is rising, which reinforces the idea that money has been flowing into the shares rather than quietly draining away.
Key Levels & Scenarios
The nearest support to watch is still US$456.16. If AMD loses that level, the chart would likely shift from stretched strength to a more obvious retracement, because that support sits well below both moving averages and would suggest buyers failed to defend the recent advance. On the upside, US$521.10 is now the immediate resistance marker because it matches the current last price and the top of the listed range. A sustained push through that area would be the first sign that the stock is trying to convert a fast rally into a new range.
The broader 3-month frame gives more context: US$584.73 is the recent high, while US$424.03 marks the low. AMD is trading much closer to the upper end of that band, which tells investors the recent rebound has already repaired a large part of the earlier decline. The question now is whether the market can keep climbing without first digesting gains.
Technical Verdict: HOLD (wait & see)
HOLD (wait & see)
- RSI at 60.7 is not exhausted, but Stochastic at 93.4 / 85.5 is overbought, signaling near-term heat after the rally.
- MACD histogram at 5.497 is positive and OBV is rising, which supports the advance, but the broader trend is still labeled sideways.
- Price above SMA20 and SMA50 is constructive, yet the shares are also pressing above the upper Bollinger band at US$516.61, which raises the odds of consolidation.
- Invalidation condition: this verdict weakens if price falls below US$456.16, the listed support.
- Ideal entry range: US$479.35 to US$498.59
- Exit target: US$521.10 to US$584.73
- Stop loss protection: US$456.16
For non-traders, that means AMD looks healthy, but after a strong jump it may need to pause before the next move.
Summary Data AMD
| Last price | 521.10 USD |
| Change 1 day / 5 days / 1 month | 3.04% / 13.38% / 9.86% |
| Trend / MA-cross | sideways / none |
| SMA20 / SMA50 | 479.35 / 498.59 |
| RSI (14) / Stochastic %K | 60.7 / 93.4 |
| Bollinger %B / ATR | 106% / 18.50 |
| Support / Resistance 20 days | 456.16 / 521.10 |
| Data as of | 9 September 2026 20:30 WIB |
Track AMD stock price daily: live levels, support/resistance and our full AMD analysis history.



