UOB Stock Technicals Today: Drops 1.01%, Momentum Gains
On September 10, 2026: price 41.18 SGD, trend downtrend, RSI 45.0, support 40.22, resistance 42.01. technical analysis of uob stock. UOB Stock Technicals —…
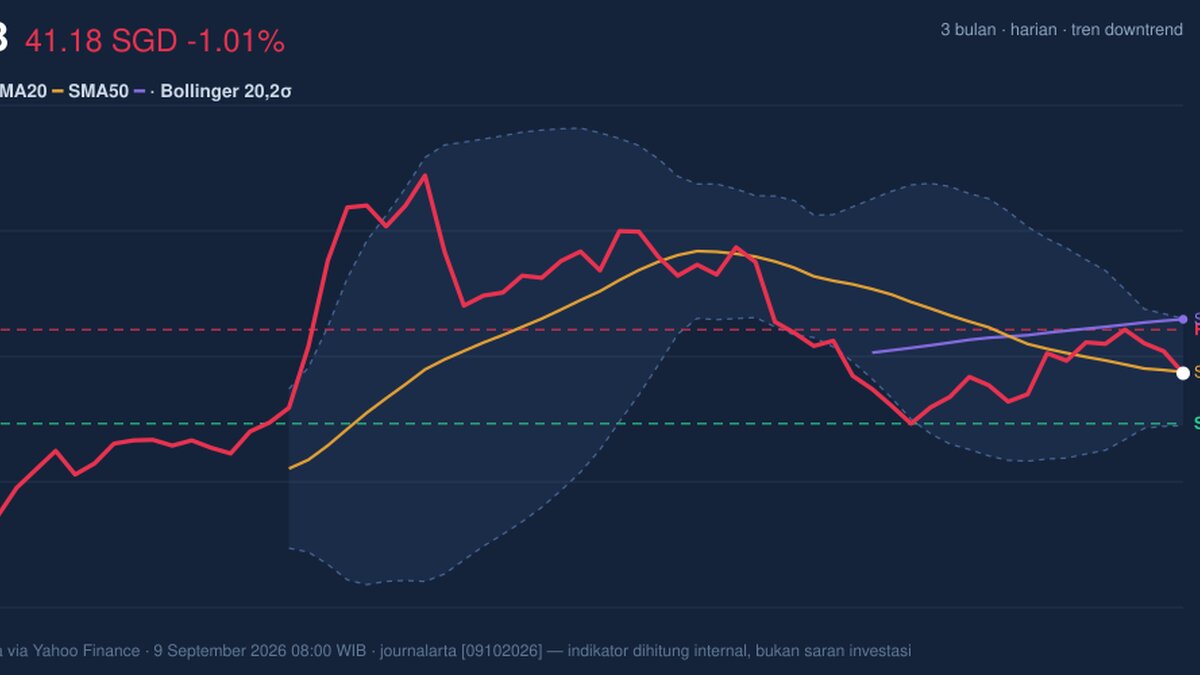
United Overseas Bank slipped to SGD 41.18 on SGX, down 1.01% from the previous close of SGD 41.60, and the chart now shows a stock that is drifting lower even as some short-term momentum gauges stop short of confirming a deeper break. The price is sitting below the SMA20 at SGD 41.20 and well under the SMA50 at SGD 42.21, which tells readers the share is still trading under both its near-term and medium-term trend lines; in plain terms, the market has not yet reclaimed the levels that would signal the sellers are losing control.
Trend & Price Action
The broader message from the moving averages is still cautious. A downtrend is in place, with the SMA20 slope at -0.70% over five days, and there is no fresh MA-cross to suggest a trend reversal has begun. That matters because moving averages are not just lines on a chart; when price stays below them, they often act like a ceiling, with rallies meeting supply from traders waiting to exit near breakeven or better. As shown in the chart, UOB is also trading in the lower half of its recent range, with the 20-day support at SGD 40.22 and 20-day resistance at SGD 42.01, and the share price is positioned at 54% of that range — not at the bottom, but not close enough to resistance to imply clean upside momentum.
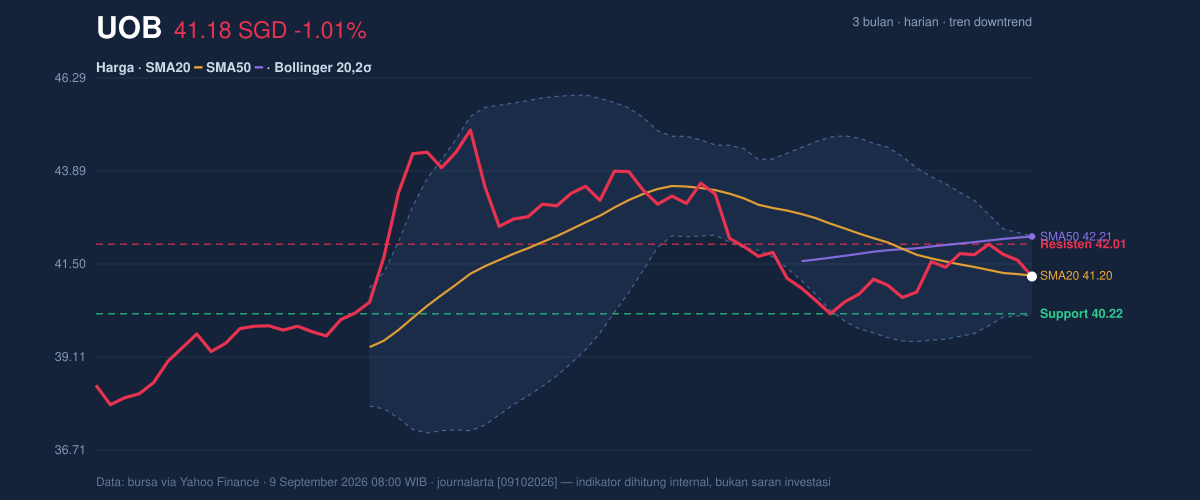
The longer backdrop is still relevant. UOB remains between its 3-month low of SGD 37.52 and 3-month high of SGD 45.15, so the stock is not in breakdown territory, but it has also not recovered enough ground to shift the narrative away from consolidation under pressure. The key signal here is that the recent pullback is happening while the broader range is intact, which often means the market is waiting for a catalyst rather than pricing in a decisive move.
Oscillators & Momentum
Momentum indicators are mixed, and that is the most important nuance in this setup. The RSI at 45.0 is neutral, which means the stock is neither stretched to the upside nor washed out on the downside; it is simply lacking conviction. The Stochastic %K at 52.5 and %D at 65.0 are also neutral, though %K sitting below %D hints that short-term buying pressure has eased. That is not a bearish collapse signal, but it does suggest the rebound energy is fading before it has fully translated into a trend change.
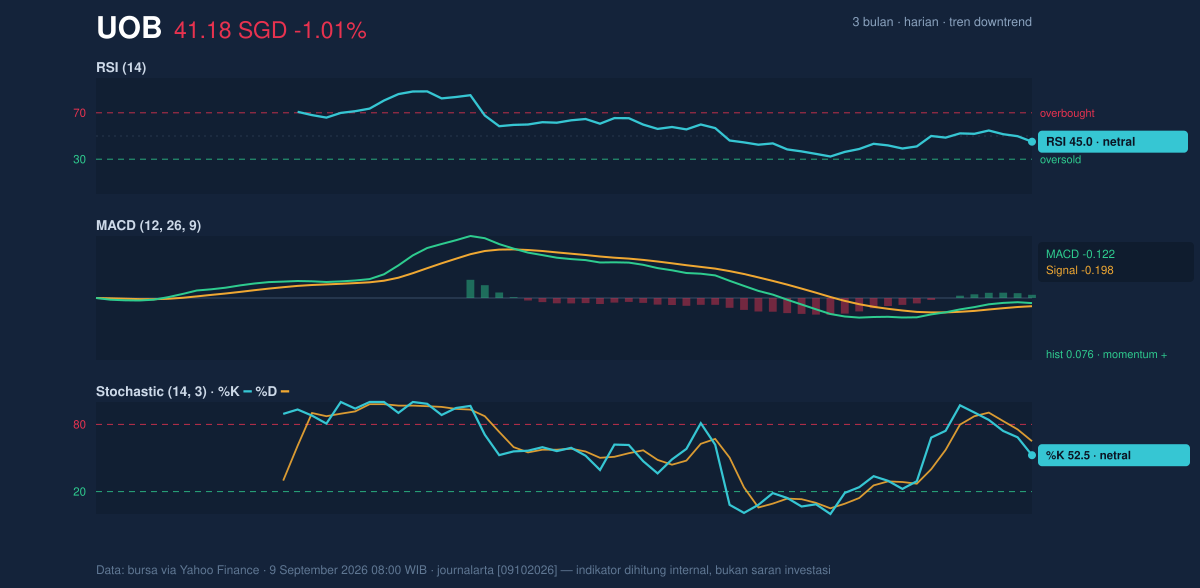
The more interesting detail is the MACD at -0.122 versus signal -0.198, with a positive histogram of 0.076. In technical terms, that means the MACD line is still below zero, so the broader trend momentum remains weak, but it has crossed above its signal line, which is a sign that downside force is easing. This is the kind of setup that often appears before a turn, yet it is only a hint, not confirmation. The chart is telling a simple story: the stock is not oversold, but it is also not showing enough follow-through to escape the downtrend cleanly.
Volatility & Volume
Volatility is subdued, which can matter more than it first appears. The ATR(14) at 0.53, or 1.3% of price, points to low volatility, meaning the daily range is relatively contained. At the same time, the Bollinger Band width is 5.0% and narrowing, a classic squeeze signal that often precedes a larger move. A squeeze does not tell direction by itself; it tells readers the market is compressing, and compressed markets tend to resolve with expansion once one side gains control.
The position inside the bands is neutral rather than extreme. The %B at 49% places price roughly in the middle of the Bollinger structure, which means UOB is neither pressing the upper band at SGD 42.23 nor testing the lower band at SGD 40.18. That middle placement, combined with lower-than-normal participation, is important. Volume came in at 2,726,100, below the 20-day average of 2,908,400, or about 0.9x normal, while OBV is falling. In plain English, the stock is not attracting enough fresh demand to validate a sustained rebound, and the declining OBV shows that volume has been leaning more toward distribution than accumulation.
Key Levels & Scenarios
The near-term map is clear. SGD 40.22 is the first support to watch, and SGD 42.01 is the first resistance that could cap any bounce. The Bollinger levels frame the same battle from a slightly different angle: SGD 40.18 on the lower band and SGD 42.23 on the upper band. If price holds above SGD 40.22, the stock can continue to trade inside a narrow band while the squeeze builds; if it falls below that support, the chart would start to lean toward a deeper test of the lower volatility boundary and, potentially, the lower part of the recent 3-month range.
If price can reclaim SGD 42.01 and then push through SGD 42.23, that would matter because it would place the stock back above resistance and the upper Bollinger band, a combination that usually signals a stronger attempt to reverse the short-term downtrend. Until then, the burden of proof remains with the bulls, and the current data do not show that proof yet.
Technical Verdict: HOLD (wait & see)
HOLD (wait & see)
- Price is below the SMA20 and SMA50, so the stock is still trading under its key trend markers.
- MACD histogram is positive, which shows downside momentum is easing, but not enough to confirm a reversal.
- Bollinger Bands are squeezing, suggesting a larger move may be coming, but direction is not yet established.
- Verdict invalidated if price breaks below SGD 40.22, because that would weaken the nearest support and increase downside pressure.
- Ideal Entry Range: SGD 40.22 to SGD 41.20
- Exit Target (Target Price): SGD 42.01 to SGD 42.23
- Stop Loss protection: below SGD 40.18
For non-traders, this means UOB looks like a stock waiting for its next move, with the chart still cautious but compressed enough that the next break could matter.
Summary Data UOB
| Last price | 41.18 SGD |
| Change 1 day / 5 days / 1 month | -1.01% / -1.41% / -1.84% |
| Trend / MA-cross | downtrend / none |
| SMA20 / SMA50 | 41.20 / 42.21 |
| RSI (14) / Stochastic %K | 45.0 / 52.5 |
| Bollinger %B / ATR | 49% / 0.53 |
| Support / Resistance 20 days | 40.22 / 42.01 |
| Data as of | 9 September 2026 08:00 WIB |
Track UOB share price daily: live levels, support/resistance and our full UOB analysis history.



