DBS Stock Analysis: Drops 0.92%, Momentum Weakens
On September 11, 2026: price 76.79 SGD, trend uptrend, RSI 54.3, support 75.53, resistance 78.65. technical analysis of dbs stock. DBS Stock Analysis — full…
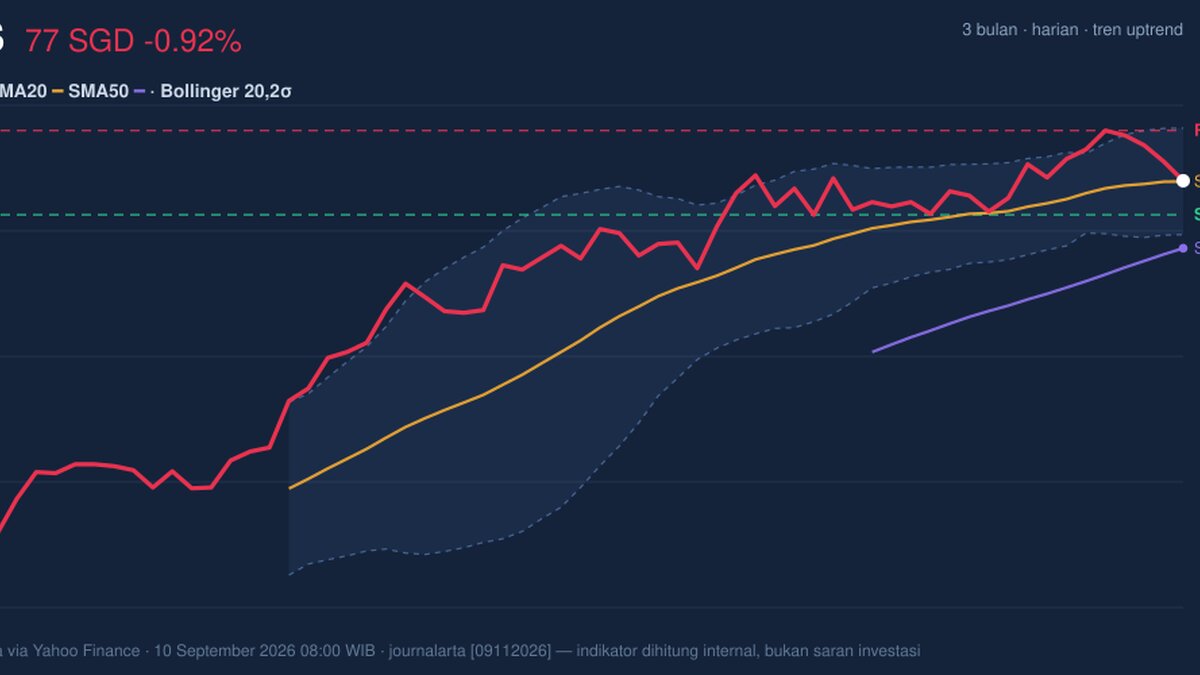
DBS Group Holdings ended at SGD 76.79, down 0.92% from the previous close of 77.50, but the more important signal is that the stock is still holding above its SMA20 at 76.77 and well above its SMA50 at 74.29. That keeps the broader trend constructive even as near-term momentum has softened. The chart shows a market that is no longer accelerating higher, yet has not broken its upward structure.
Trend & Price Action
The price sits in an uptrend, with the SMA20 rising at 0.57% over 5 days, which matters because a rising short-term average usually means buyers have been willing to absorb pullbacks. DBS is trading almost exactly on top of the 20-day mean, a sign of balance rather than weakness. In practical terms, the share is neither stretched far above trend nor clearly rolling over; it is pausing near the center of its short-term lane.
That pause is visible in the range data. The stock is trading in the lower half of the recent band, with price at about 40% of the 20-hour range, while the 3-month high is 79.05 and the 3-month low is 61.60. The gap between the current price and the recent peak is not large, but it is enough to show that the market is still working to reclaim the upper end of the range.
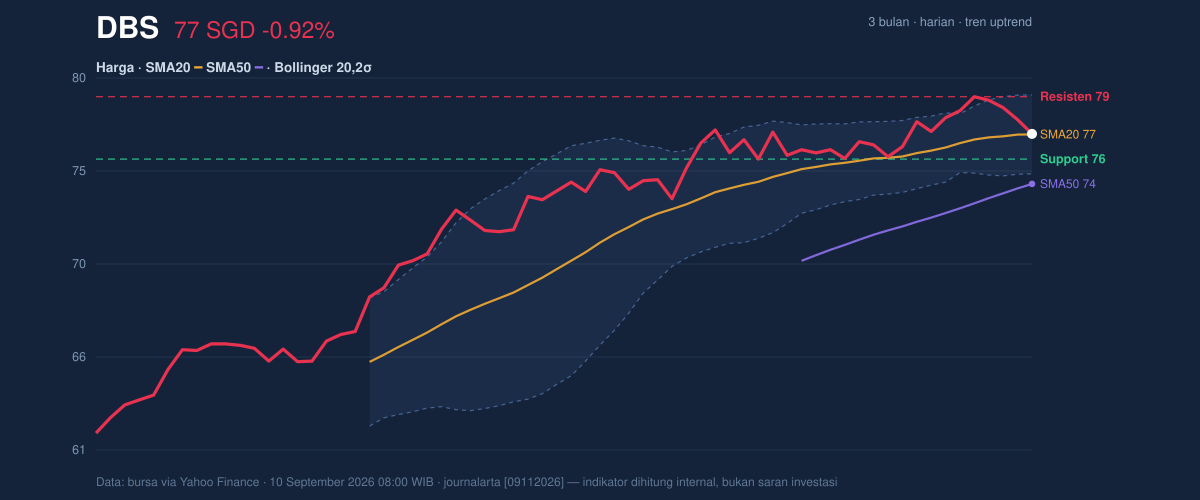
The Bollinger setup adds an important nuance. The middle band is 76.77, the lower band is 74.79, and the upper band is 78.74. With price sitting near the middle band and the band width at just 5.1%, the stock is in a squeeze — a compressed state that often precedes a sharper move. A squeeze does not predict direction by itself; it only says the market is storing energy. The next break is likely to matter more than the current drift.
Oscillators & Momentum
The oscillators are mixed, which is exactly what one would expect when trend and momentum are no longer perfectly aligned. The RSI at 54.3 is neutral, meaning the stock is not overbought and not oversold. That is healthy, but it also shows there is no strong momentum push behind the latest move. The Stochastic %K at 43.2 and %D at 60.1 are also neutral, but the %K sitting below %D suggests short-term momentum has cooled.
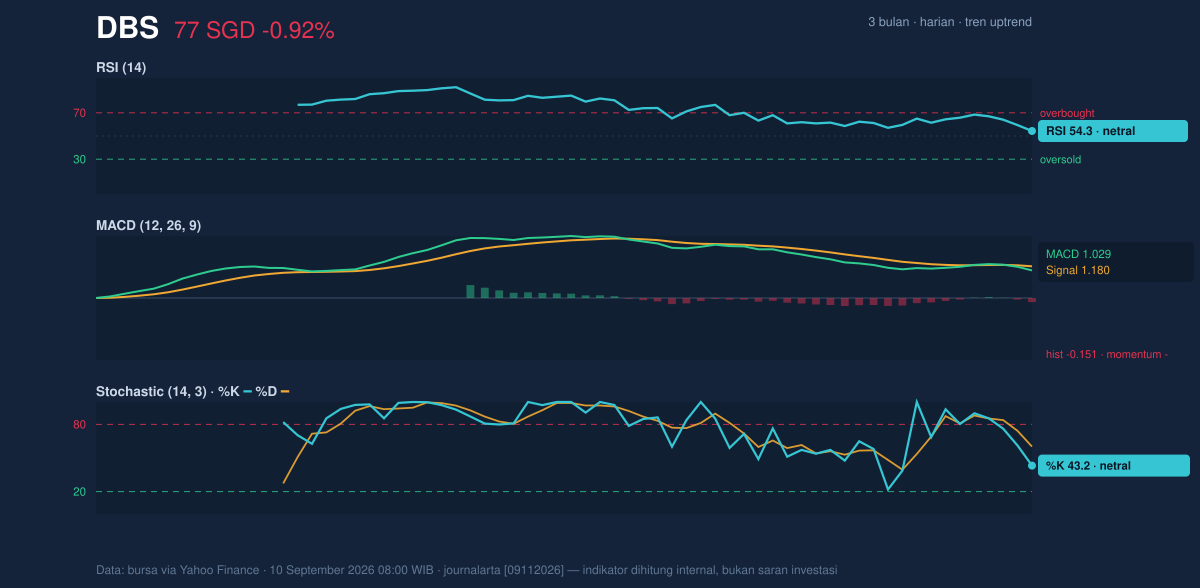
The most cautionary signal comes from MACD. The MACD at 1.029 is below the signal line at 1.180, leaving a -0.151 histogram. In plain English, that means the trend is still positive on a broader basis, but the speed of the move has slowed enough that downside pressure is now edging ahead of upside impulse. It is not a bearish collapse signal; it is a warning that the stock may need fresh demand to keep climbing.
Volatility & Volume
Volatility is subdued. The ATR(14) at 0.91, equal to only 1.2% of price, says daily swings have been relatively contained. Low ATR often pairs with a Bollinger squeeze, and together they imply the market is coiling rather than trending hard. For DBS, that combination usually means the next decisive move could come quickly once price leaves the current compression zone.
Volume offers a modest confirmation to the bullish side. Last session traded 4,260,100 shares versus a 20-day average of 3,573,145, or about 1.2× normal. That is not an explosive surge, but it does show participation on a down day, which can be read two ways: some holders are active, but the fact that OBV is rising suggests accumulation is still outweighing distribution over time. In other words, the market is not showing the kind of volume pattern that usually accompanies a clean trend break lower.
Key Levels & Scenarios
The nearest technical floor is 75.53, the 20-hour support. Beneath that sits the lower Bollinger band at 74.79, which also aligns closely with the SMA50 at 74.29. That cluster matters because multiple supports in the same area tend to attract attention from traders watching for trend integrity. On the upside, 78.65 is the immediate resistance, just under the Bollinger ceiling at 78.74. Above that, the 3-month high at 79.05 becomes the next reference point.
If DBS holds above 75.53 and starts reclaiming 78.65, the chart would suggest a renewed attempt toward the upper band and the recent high. If it slips below 74.79, the squeeze would be resolving to the downside, and the market would be signaling that the recent uptrend has lost its short-term grip. The key point is that the stock is close enough to both support and resistance that the next move will likely define the tone for the coming sessions.
Technical Verdict: HOLD (wait & see)
The setup is constructive, but not decisive. The uptrend remains intact because price is above the SMA20 and SMA50, OBV is rising, and volume is running above average. But MACD is negative versus its signal line, RSI is neutral, and the stock is sitting inside a Bollinger squeeze, which means direction has not yet been confirmed.
- Ideal Entry Range: 75.53 to 76.77
- Exit Target: 78.65 to 79.05
- Stop Loss protection: below 74.79
This verdict is invalidated if price breaks and holds below 74.79.
For non-traders: DBS is still in an uptrend, but the chart is waiting for proof that the next move is upward rather than downward.
“The market has not turned weak — it has just reached the point where it must choose.”
Summary Data DBS
| Last price | 76.79 SGD |
| Change 1 day / 5 days / 1 month | -0.92% / -1.49% / 0.38% |
| Trend / MA-cross | uptrend / none |
| SMA20 / SMA50 | 76.77 / 74.29 |
| RSI (14) / Stochastic %K | 54.3 / 43.2 |
| Bollinger %B / ATR | 51% / 0.91 |
| Support / Resistance 20 days | 75.53 / 78.65 |
| Data as of | 10 September 2026 08:00 WIB |
Track DBS share price daily: live levels, support/resistance and our full DBS analysis history.