OCBC Stock Analysis: Gains 0.13%, Momentum Weakens
On September 11, 2026: price 31.39 SGD, trend sideways, RSI 57.0, support 30.78, resistance 32.27. technical analysis of ocbc stock. OCBC Stock Analysis — full…
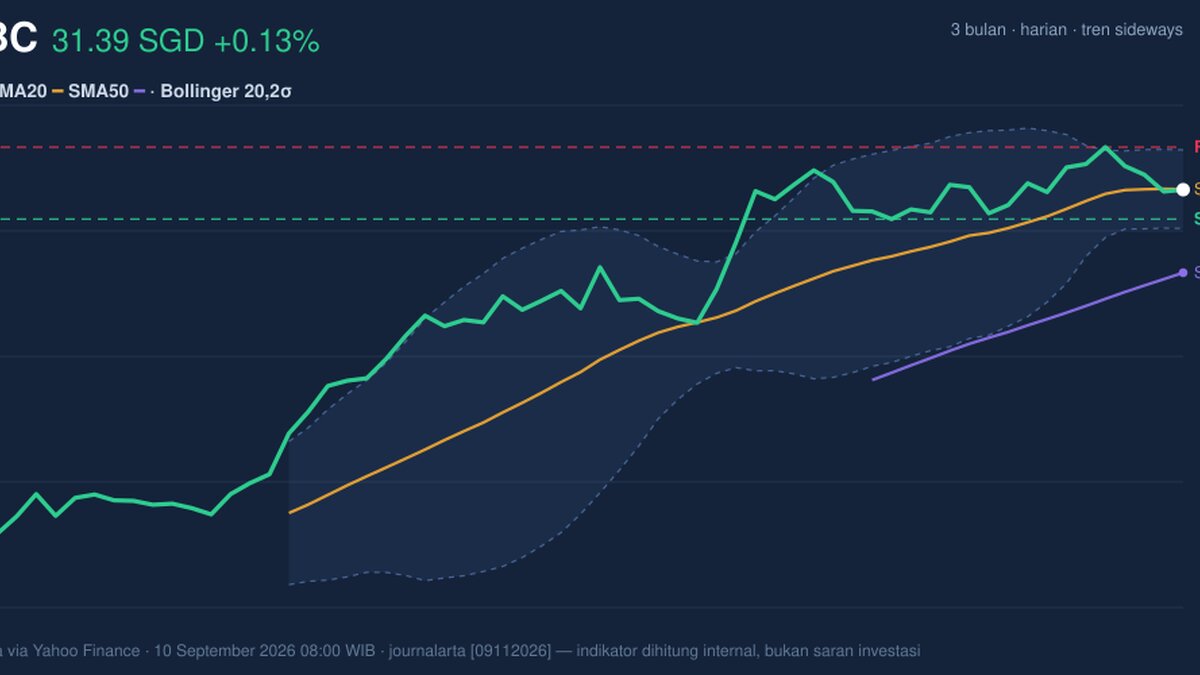
OCBC Bank’s shares were last quoted at 31.39 SGD on SGX, just below the SMA20 at 31.40 and fractionally above the previous close of 31.35. That tiny gap matters more than the daily move itself: it shows the stock is still trading right on its short-term average, a sign of consolidation rather than a decisive trend. As shown in the chart, the price sits in a narrow band between the recent floor and ceiling, while momentum signals are mixed enough to keep the tape cautious.
Trend & Price Action
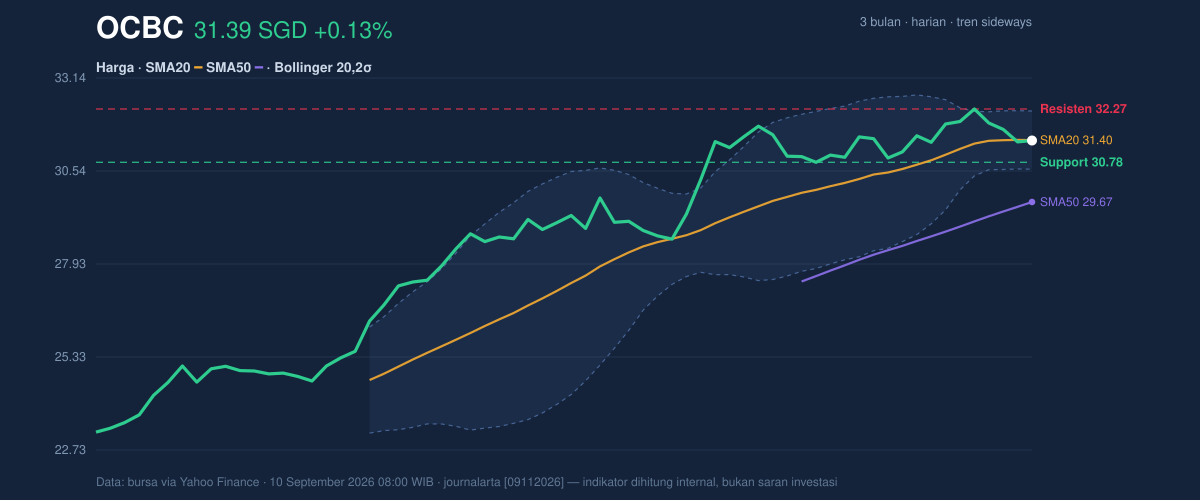
The broader setup remains sideways, and the slope of the SMA20 at 0.79% over 5 days suggests the short-term line is still inching higher even though price is not yet cleanly above it. That combination often signals a market that is stabilising after a pause, rather than one already in a strong directional run. The SMA50 at 29.67 sits well below the current price, so the medium-term structure is still healthier than the day-to-day chart might imply.
The absence of a fresh MA-cross means there is no new moving-average trigger forcing a trend change. In plain terms, the chart is not giving a strong breakout or breakdown signal yet. The stock is also trading at about 41% of its 20-day range, which places it in the lower-middle portion of that recent band, not at an extreme that would usually signal urgency.
Oscillators & Momentum
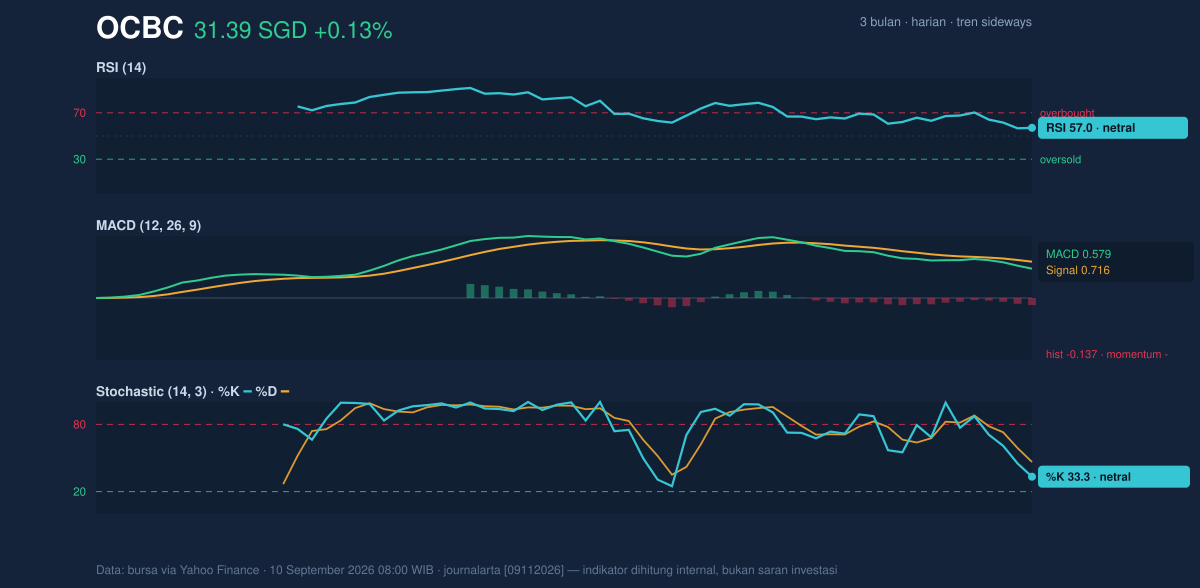
The momentum picture is more restrained than the price action suggests. RSI at 57.0 is neutral, which means the stock is neither overbought nor oversold and still has room to move in either direction. That is important because a neutral RSI near the middle of the range often reflects balance, not conviction.
The Stochastic %K at 33.3 and %D at 46.4 also read as neutral, but with %K below %D, the short-term momentum is softer than the broader oscillator trend. In practical terms, buyers have not fully regained control after the recent pullback. The MACD at 0.579 remains above zero, which would normally be constructive, but the signal line at 0.716 and the histogram at -0.137 show that momentum has turned negative in the very near term. That is a classic “not bearish, but not confirming” setup.
Volatility & Volume
The Bollinger Band structure is telling. With the middle band at 31.40, the stock is effectively hugging its short-term mean, while the upper band at 32.22 and lower band at 30.59 frame the likely trading corridor. The %B at 49% means price is almost exactly in the middle of the band, another sign of equilibrium. More importantly, the band width of 5.2% is narrowing, which points to a squeeze. That matters because squeezes often precede a sharper move, even if the direction is not yet clear.
Volatility is present but not wild. The ATR at 0.49, equal to 1.6% of price, indicates a moderate daily swing range. That supports the idea that any breakout would need follow-through rather than just a one-session spike. Volume gives a slightly better tone: the latest turnover of 4,980,800 is only 0.9x the 20-session average, so participation is lighter than normal. Still, the fact that OBV is rising suggests underlying accumulation has not disappeared, even if the current session was not especially forceful. In other words, money flow is better than the headline volume suggests.
Key Levels & Scenarios
The immediate technical map is clear. Support at 30.78 is the first level to watch, while resistance at 32.27 is the first ceiling that has to be cleared before the chart can improve. The Bollinger extremes reinforce that structure, with 30.59 acting as the lower band and 32.22 as the upper band. The stock’s 3-month high at 32.57 is just above that resistance zone, which means any move through the upper 32s would likely need stronger participation to matter.
If price holds above 30.78 and starts pushing back toward 32.22 to 32.27, the chart would begin to look like a squeeze resolving upward. If it fails to hold 30.78, the lower Bollinger band at 30.59 becomes the next area where the market would test whether the sideways pattern is turning into a deeper pullback. The wider medium-term range still matters too: the 3-month low at 23.11 is far away, so the current debate is about near-term direction, not a structural breakdown.
Technical Verdict: HOLD (wait & see)
The chart does not yet justify a directional call with conviction. MACD momentum is negative, price is sitting just below the SMA20, and volume is below average, so the stock is not showing the kind of immediate strength that would confirm an upside break. At the same time, RSI remains neutral, OBV is rising, and the Bollinger Bands are tightening, which means the setup is more of a coiled pause than a clear deterioration.
- Ideal Entry Range: 30.78 to 31.40, using the support zone and the SMA20 as the technical area where price is still being defended.
- Exit Target: 32.22 to 32.27, aligned with the upper Bollinger Band and the nearest resistance.
- Stop Loss protection: below 30.59, where the lower Bollinger Band sits, with 30.78 as the nearer warning level.
- Verdict invalidated if price breaks below 30.59, because that would mean the squeeze is resolving lower instead of stabilising.
For non-traders: the chart says OCBC is sitting in a waiting zone, where the next decisive move matters more than the current small daily change.
Summary Data OCBC
| Last price | 31.39 SGD |
| Change 1 day / 5 days / 1 month | 0.13% / -1.66% / -0.35% |
| Trend / MA-cross | sideways / none |
| SMA20 / SMA50 | 31.40 / 29.67 |
| RSI (14) / Stochastic %K | 57.0 / 33.3 |
| Bollinger %B / ATR | 49% / 0.49 |
| Support / Resistance 20 days | 30.78 / 32.27 |
| Data as of | 10 September 2026 08:00 WIB |
Track OCBC share price daily: live levels, support/resistance and our full OCBC analysis history.