UOB Stock Drops 0.46% Today, Momentum Gains
On September 11, 2026: price 40.99 SGD, trend downtrend, RSI 43.2, support 40.22, resistance 42.01. technical analysis of uob stock. UOB Stock Drops — full…
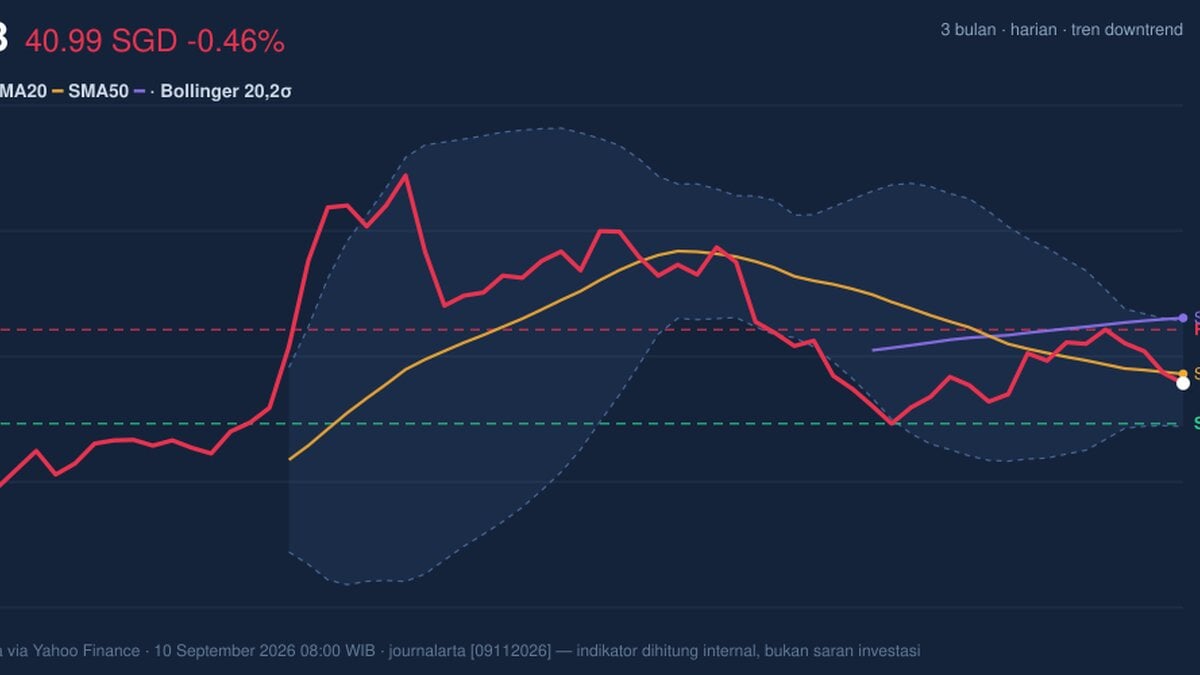
United Overseas Bank slipped to 40.99 SGD on SGX, down 0.46% from the previous close of 41.18, as the stock stayed below its short-term average and traded closer to the lower half of its recent range. The move is modest in absolute terms, but the message from the chart is clearer: UOB is still in a downtrend, even though some momentum gauges are starting to stabilise rather than accelerate lower.
Trend & Price Action
As shown in the chart, the share price is sitting below the SMA20 at 41.17 and well under the SMA50 at 42.24, which tells traders that the recent bounce attempts have not yet reclaimed control from sellers. The SMA20 is sloping down by 0.62% over five days, so the short-term trend is not merely flat; it is leaning lower, and that usually means rallies tend to meet supply rather than turn into sustained recoveries.
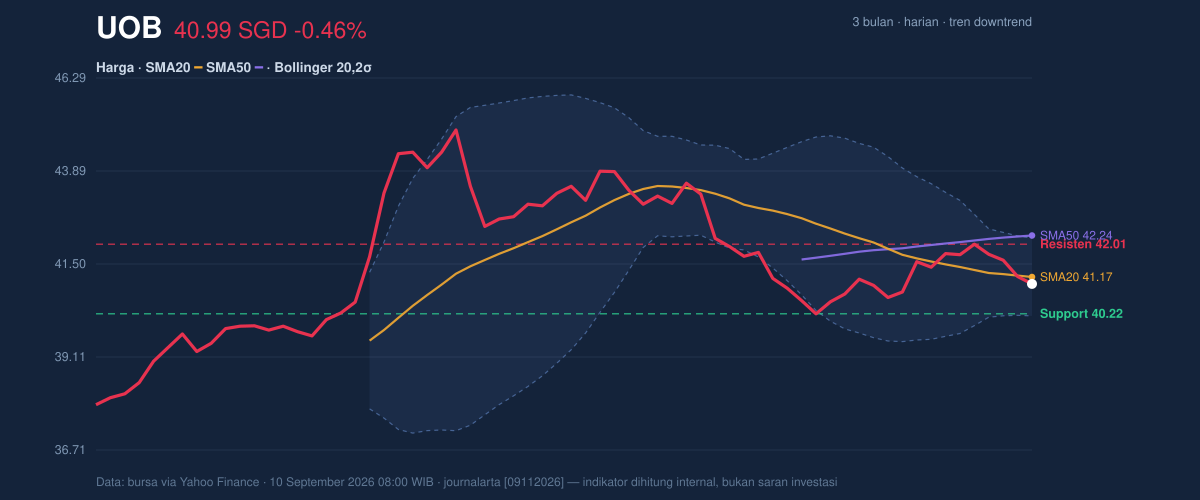
The price is also positioned at about 43% of the 20-hour range, with support at 40.22 and resistance at 42.01. That placement matters because it shows UOB is not testing the breakdown zone yet, but neither is it near the upper boundary that would suggest buyers have regained initiative. In practical terms, the stock is still in the middle-to-lower part of a range where patience, not conviction, is the dominant market stance.
The broader three-month band adds context. UOB has traded between a 3-month high of 45.15 and a 3-month low of 37.52, and the current price remains closer to the lower end of that span than the top. That does not confirm a new leg down on its own, but it does show the market has not yet repaired the damage from the earlier slide.
Oscillators & Momentum
Momentum is mixed rather than decisively bearish, which is important because mixed signals can sometimes precede a turn, but only if price confirms them. The RSI at 43.2 is neutral, meaning the stock is neither stretched on the upside nor deeply oversold. That usually points to a market that is waiting for a catalyst rather than one already in panic mode.
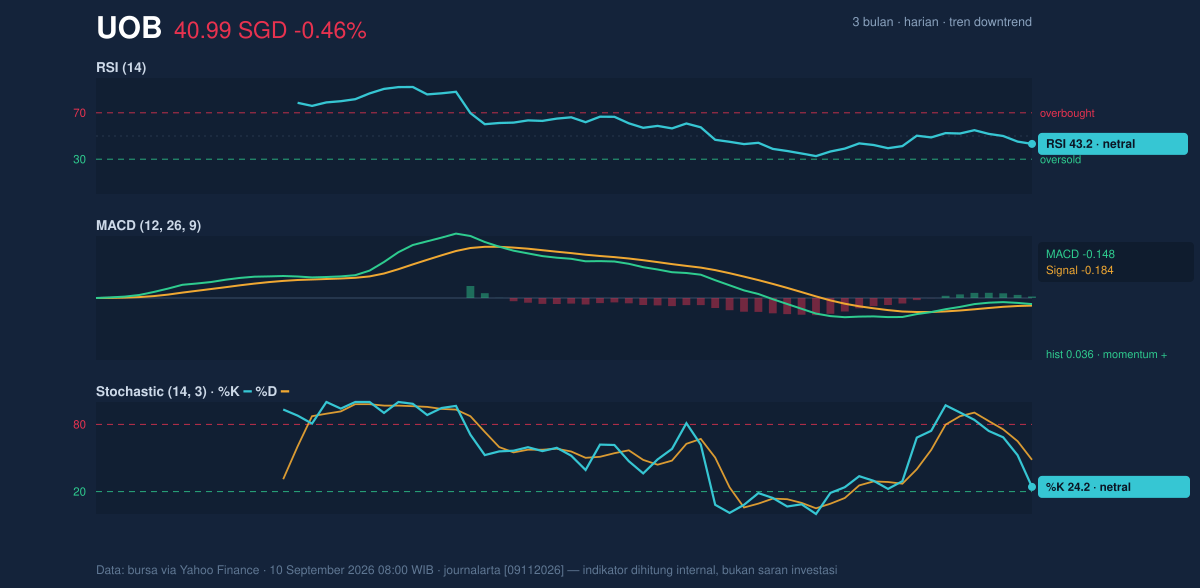
The Stochastic %K at 24.2 and %D at 48.4 suggest the stock is closer to the lower part of its short-term momentum band, but not yet in a clean reversal setup. In plain English, the oscillator is hinting that downside pressure has eased, yet it has not fully turned into a confirmed rebound signal.
The MACD is -0.148 versus a signal line of -0.184, leaving a positive histogram of 0.036. That is the most constructive part of the setup. When the histogram turns positive while the broader trend remains weak, it often means bearish momentum is fading before the price itself starts to improve. Still, this is early-stage improvement, not proof of a trend change.
Volatility & Volume
Volatility is subdued. The ATR(14) at 0.49, or 1.2% of price, indicates relatively low day-to-day movement, which often precedes a sharper move once the market chooses direction. That fits with the Bollinger Bands, where the upper band is 42.17, the middle band is 41.17 and the lower band is 40.17. The band width of 4.9% is notably tight, signalling a squeeze — a compression phase that can lead to breakout conditions.
The squeeze matters more because it is occurring while the stock trades below the middle band. A squeeze below the midline tends to favour continuation risk unless buyers can force a move back above the centre of the band. The %B at 41% also places price in the lower half of the band structure, which reinforces the idea that the stock is still under mild pressure.
Volume is not offering much help to the bulls. Last trade volume was 2,365,600, below the 20-day average of 2,805,215, or about 0.8× normal. That means the latest dip was not accompanied by strong participation, which reduces the conviction of the move but also limits how forceful the selling looks. The more notable warning is that OBV is falling, showing that cumulative volume flow has been drifting out of the stock even when price action looks relatively contained.
Key Levels & Scenarios
The nearest technical floor is 40.22, and that is the first level to watch because it sits just below the current price and near the lower Bollinger band at 40.17. If that area gives way, the chart would start to look more fragile, with the market likely testing whether the recent low zone can absorb further selling.
On the upside, 42.01 is the first resistance to clear, followed by the SMA50 at 42.24 and the upper Bollinger band at 42.17. A move through that cluster would matter because it would show the stock has reclaimed both the range ceiling and the trend marker that has capped recovery attempts. Until then, rallies are better viewed as corrective rather than decisive.
The core signal is that UOB is still technically weak, but the fading bearish momentum and tight Bollinger squeeze leave the chart poised for a directional move rather than a settled trend.
Technical Verdict: HOLD (wait & see)
- Verdict: HOLD (wait & see)
- Reason 1: Price is below SMA20 and SMA50, and the SMA20 is sloping down, so the trend remains negative.
- Reason 2: MACD histogram is positive, which suggests bearish momentum is fading, but not enough to confirm a reversal.
- Reason 3: Bollinger Bands are in a squeeze and ATR is low, pointing to a pending move that still needs confirmation.
- Invalidation condition: the verdict is invalidated if price falls below 40.22, which would expose the lower band area around 40.17 and weaken the current base.
- Ideal Entry Range: 40.22 to 41.17
- Exit Target: 42.01 to 42.24
- Stop Loss protection: below 40.17
In plain English, the stock is not showing a clean recovery yet, but it is also not flashing a full breakdown signal, so the chart is waiting for price to prove which side wins next.
Summary Data UOB
| Last price | 40.99 SGD |
| Change 1 day / 5 days / 1 month | -0.46% / -1.80% / -1.70% |
| Trend / MA-cross | downtrend / none |
| SMA20 / SMA50 | 41.17 / 42.24 |
| RSI (14) / Stochastic %K | 43.2 / 24.2 |
| Bollinger %B / ATR | 41% / 0.49 |
| Support / Resistance 20 days | 40.22 / 42.01 |
| Data as of | 10 September 2026 08:00 WIB |
Track UOB share price daily: live levels, support/resistance and our full UOB analysis history.