AstraZeneca Momentum Weakens: Stock Gains 3.37% (September 15, 2026)
On September 15, 2026: price 12,154.00 GBp, trend sideways, RSI 41.4, support 11,460.00, resistance 12,476.00. technical analysis of astrazeneca stock.

AstraZeneca shares on the LSE rose to 12,154.00 GBp by 14:00 WIB on 11 September 2026, up 3.37% on the day, according to exchange data via Yahoo Finance. The move matters because it has pushed the stock back above its short-term average, but not yet into a clean trend reversal. As shown in the chart, the price is trying to stabilise in the upper half of its recent trading band, while momentum remains mixed rather than convincing.
Trend & Price Action
The first signal is that AstraZeneca is now trading above its SMA20 at 11,961.60, which usually suggests the latest bounce has enough strength to reclaim near-term momentum. But the broader message is less straightforward. The stock still sits below its SMA50 at 12,377.08, so the medium-term trend has not fully turned up, and the data still classifies the overall pattern as sideways.
That matters because sideways markets often reward patience more than prediction. The SMA20 slope of -0.04% over 5 days says the short-term trend is flattening, not accelerating. In plain English, the share price is drifting rather than breaking decisively in one direction.
The Bollinger setup reinforces that reading. With the middle band at 11,961.60, the upper band at 12,446.44 and the lower band at 11,476.76, the stock is trading in the upper part of its range but still below the upper boundary. The %B reading of 70% shows price is closer to the top of the band than the bottom, which usually signals improving tone, though not necessarily a breakout. The 8.1% band width is normal, so there is no squeeze suggesting an imminent volatility burst.
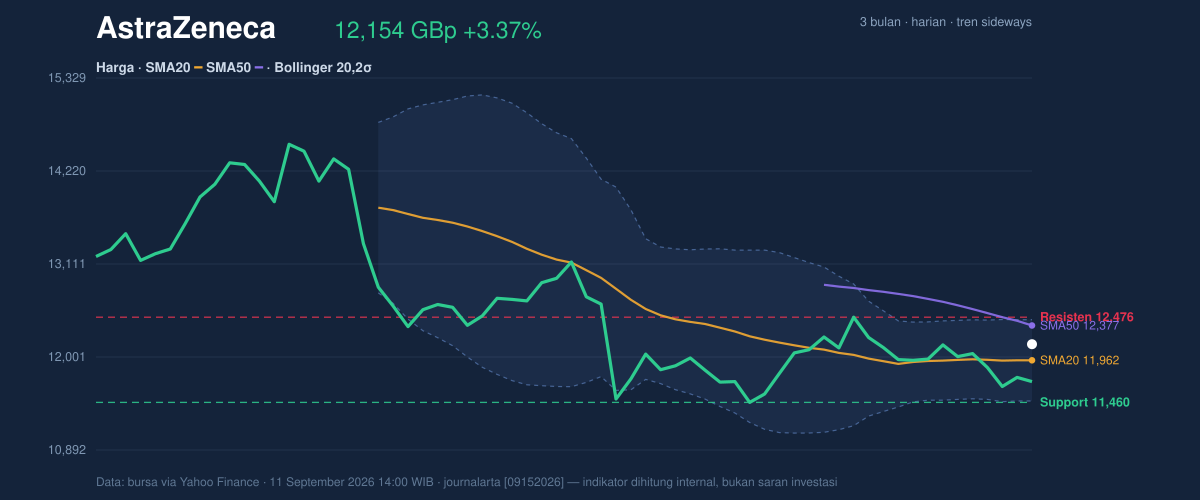
The key point is that AstraZeneca is holding above nearby support, but it has not yet proved it can absorb supply around the upper end of the range. The 20-hour support at 11,460.00 and 20-hour resistance at 12,476.00 frame the battle. At the current price, the stock is sitting around 68% of the range, which means it is leaning upward, but not at the ceiling.
Oscillators & Momentum
Momentum is where the picture becomes more cautious. The RSI at 41.4 is neutral, which tells us the stock is neither stretched nor deeply washed out. That is important because a neutral RSI often means the market is waiting for a fresh catalyst rather than already pricing one in.
The stochastics are more interesting. With %K at 16.9 and %D at 15.0, the stock is in oversold territory. For general readers, stochastic oscillators compare the latest price with its recent range; readings this low often show that selling has been heavy enough to leave the stock technically tired. But oversold does not mean it must rise. It means downside pressure may be losing force.
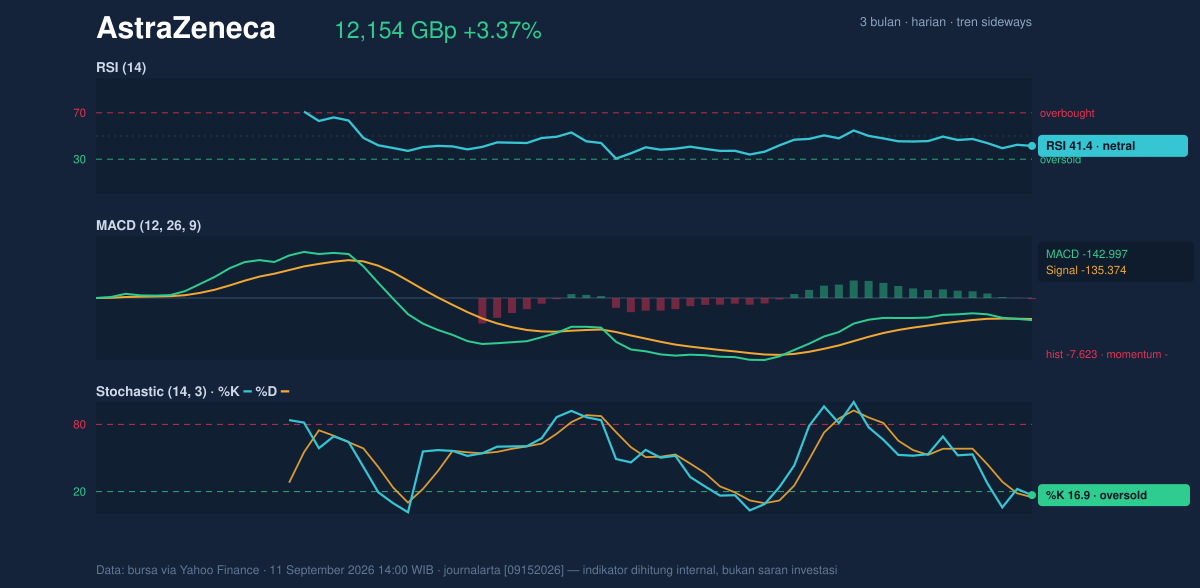
That warning is especially relevant because MACD is still negative. The MACD at -142.997, below the signal line at -135.374, with a histogram of -7.623, indicates negative momentum remains in place. In practical terms, the rebound has not yet produced a bullish crossover in the trend-following indicator that many traders watch for confirmation.
So the oscillators are split: stochastics suggest the stock may be near a short-term exhaustion point on the downside, while MACD says the broader momentum trend is still weak. That combination often leads to choppy trading rather than a smooth move.
Volatility & Volume
Volatility is moderate, not explosive. The ATR(14) of 290.32, equal to 2.4% of price, implies AstraZeneca can still move meaningfully in a session, but not in a disorderly way. ATR, or average true range, is a measure of typical daily movement; here it suggests the stock has room to travel, yet not in a panic-driven fashion.
Volume is the more cautionary signal. Last volume came in at 1,474,760, well below the 20-hour average of 2,743,075, or about 0.5× normal. That means the day’s rise has been achieved with relatively thin participation. Moves on light volume can fade if larger holders do not join in.
The OBV is down, which is another warning sign. On-balance volume is a simple way of tracking whether money is flowing into or out of a stock over time. A falling OBV suggests that, despite the price bounce, the balance of participation has not yet convincingly shifted to the buyers’ side.
The stock is also still far below its 3-month high of 15,126.00 and above its 3-month low of 9,892.00. That places the current move in context: this is a recovery inside a broad range, not a return to prior highs.
Key Levels & Scenarios
The most important levels are clear. 11,460.00 is the first line of defence, because it marks 20-hour support and sits close to the lower Bollinger band at 11,476.76. If that area gives way, the chart would lose its near-term footing quickly.
On the upside, 12,377.08 and 12,476.00 are the levels that matter most. The first is the SMA50, which often acts like a medium-term pressure point, and the second is nearby resistance. A move through both would improve the technical structure materially, because it would show the stock can reclaim the part of the chart where sellers have recently been active.
For now, the price is above the short-term average but below the medium-term average, with momentum indicators still divided. That usually points to a market in repair, not yet in command.
Technical Verdict: HOLD (wait & see)
HOLD (wait & see) because the chart shows recovery above the SMA20, but MACD remains negative and volume is too light to confirm broad participation. The stochastic oscillator is oversold, which supports the idea of a bounce, yet the stock is still below the SMA50 and resistance has not been cleared. The verdict is invalidated if price breaks below 11,460.00.
- Ideal Entry Range: 11,960.00 to 12,154.00
- Exit Target (Target Price): 12,377.08 to 12,476.00
- Stop Loss protection: 11,460.00
In plain English: the shares are recovering, but they have not yet shown enough strength to call the move settled.
Summary Data AstraZeneca
| Last price | 12,154.00 GBp |
| Change 1 day / 5 days / 1 month | 3.37% / 1.23% / 3.81% |
| Trend / MA-cross | sideways / none |
| SMA20 / SMA50 | 11,961.60 / 12,377.08 |
| RSI (14) / Stochastic %K | 41.4 / 16.9 |
| Bollinger %B / ATR | 70% / 290.32 |
| Support / Resistance 20 days | 11,460.00 / 12,476.00 |
| Data as of | 11 September 2026 14:00 WIB |
