AstraZeneca Stock Analysis: Gains 3.48%, Momentum Gains
On September 16, 2026: price 12,116.00 GBp, trend sideways, RSI 52.3, support 11,560.00, resistance 12,476.00. technical analysis of astrazeneca stock.

AstraZeneca’s shares on the London Stock Exchange were changing hands at 12,116.00 GBp by 14 September 2026 14:00 WIB, up 3.48% on the day, as the stock pushed back above its short-term average and traded closer to the upper half of its recent range. That move matters because it shows buyers have regained some control after a period of sideways trade, but not enough to claim a fresh trend has fully formed. The chart, as shown below, points to a market that is improving rather than accelerating.
Trend & Price Action
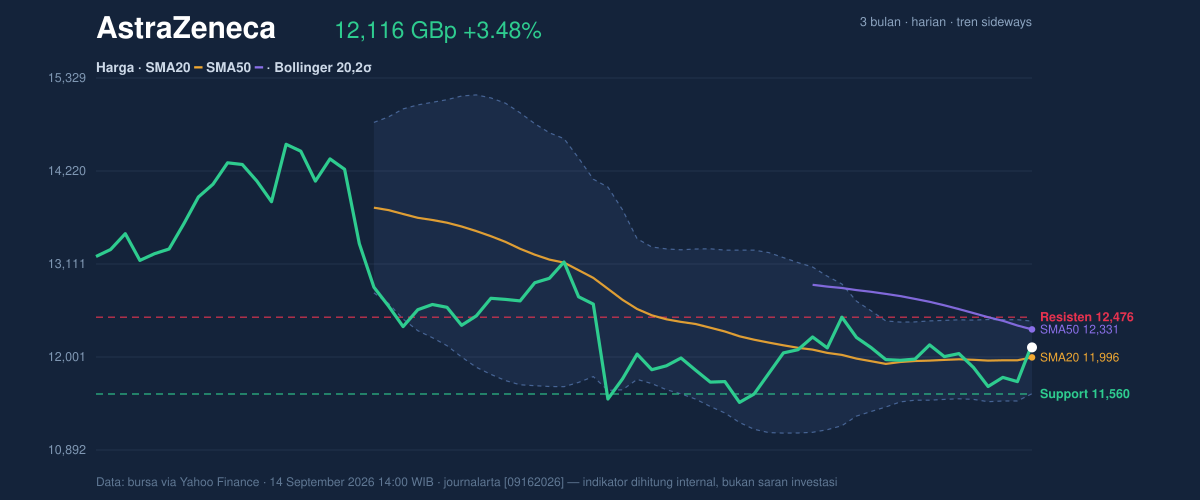
The share price is now sitting above SMA20 at 11,996.30 but still below SMA50 at 12,331.04, which is the classic setup of a stock trying to recover without yet proving a sustained breakout. In plain terms, the shorter-term trend has turned firmer, while the medium-term trend is still acting as a ceiling. With no new MA-cross, there is no fresh moving-average signal to suggest a decisive shift in regime.
That is consistent with the broader label of sideways trend and the modest 0.18%/5 days slope on SMA20. The slope is important: it tells readers the 20-day average is not falling sharply, so the chart is not under clear distribution pressure. But it is also not rising strongly enough to imply momentum has become self-sustaining.
The stock is trading at about 61% of its 20-day range, which places it above the midpoint but still short of the upper boundary. That positioning usually signals a market with some buying interest, yet one that remains vulnerable to being pulled back toward support if volume fades.
Oscillators & Momentum
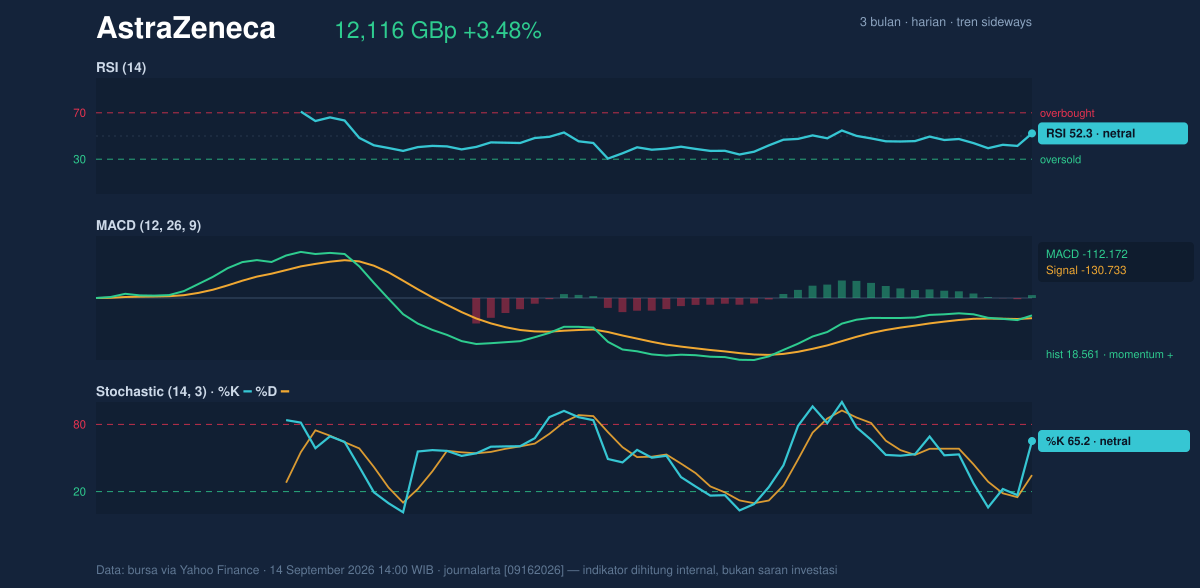
Momentum indicators are broadly constructive, though not overheated. The RSI(14) at 52.3 is neutral, which means the stock is neither overbought nor oversold. That matters because a neutral RSI often leaves room for continuation if price action is supported by volume, but it also means there is no strong momentum edge from the oscillator itself.
The Stochastic %K at 65.2 and %D at 34.8 suggests the shorter swing impulse is firmer than the slower line beneath it. In simple terms, that can reflect a market in recovery mode, where recent prices are improving faster than the broader short-term baseline. It is not a strong overbought reading, but it does show the stock has some near-term traction.
The more telling signal is the MACD at -112.172 versus the signal line at -130.733, with a positive histogram of 18.561. MACD remains below zero, so the stock has not fully escaped its longer bearish backdrop. But the positive histogram means the gap is narrowing in a bullish direction, which is often read as improving internal momentum before the headline trend turns. That is a subtle but important distinction: the stock is not yet strong, but it is becoming less weak.
Volatility & Volume
The Bollinger Bands add another layer to the picture. Price is trading at a %B of 64%, meaning it is above the mid-band and leaning toward the upper half of the envelope without pressing the top. The upper band at 12,429.13 is the nearest volatility-based resistance, while the lower band at 11,563.47 aligns closely with chart support. The 7.2% band width is relatively tight and is described as a squeeze, which often precedes a larger move once price escapes the range. A squeeze does not tell direction on its own; it tells readers the market is storing energy.
Volume gives the move more credibility. Last trade volume of 6,470,194 was 2.3× the 20-hour average of 2,852,944, and OBV is rising. That combination suggests the latest advance was not just a thinly traded drift higher. Rising OBV means volume has been accumulating in a way that typically supports the price move, rather than contradicting it. The ATR(14) at 311.89, or 2.6% of price, indicates volatility is moderate rather than extreme, so the stock has room to move without implying disorderly trading.
Key Levels & Scenarios
The immediate map is clear. Support sits at 11,560.00, while resistance is 12,476.00. Those levels matter because they frame whether the recent bounce is just a rebound inside a range or the start of a push toward the upper end of the chart.
If AstraZeneca holds above 11,996.30 and can challenge 12,331.04 with volume still above average, the chart would begin to look more like a constructive recovery. If it fails to sustain above the 20-day average, the market may drift back toward 11,560.00, where the next test of demand would be concentrated. The 3-month high at 15,126.00 and 3-month low at 9,892.00 show the stock is still well inside a wide historical corridor, so this is not a breakout from a compressed long-term base yet.
Technical Verdict: HOLD (wait & see)
HOLD (wait & see)
- RSI at 52.3 is neutral, so momentum is supportive but not decisive.
- MACD histogram at 18.561 is positive, showing improving momentum, but the MACD line remains below zero.
- Price above SMA20 and volume at 2.3× average argue for better participation, yet price remains below SMA50, which still caps the recovery.
- Verdict invalidated if price falls below 11,560.00.
- Ideal Entry Range: 11,996.30 to 12,116.00 GBp
- Exit Target: 12,331.04 to 12,476.00 GBp
- Stop Loss protection: 11,560.00 GBp
For non-traders, that means the shares are improving, but they have not yet proven they can leave the current range behind.
The latest 20-hour support level remains 11,560.00.
Summary Data AstraZeneca
| Last price | 12,116.00 GBp |
| Change 1 day / 5 days / 1 month | 3.48% / 0.61% / 5.72% |
| Trend / MA-cross | sideways / none |
| SMA20 / SMA50 | 11,996.30 / 12,331.04 |
| RSI (14) / Stochastic %K | 52.3 / 65.2 |
| Bollinger %B / ATR | 64% / 311.89 |
| Support / Resistance 20 days | 11,560.00 / 12,476.00 |
| Data as of | 14 September 2026 14:00 WIB |
