NKE Stock Technicals Today: Gains 1.62%, Momentum Weakens
On September 18, 2026: price 36.36 USD, trend downtrend, RSI 35.4, support 35.78, resistance 40.76. technical analysis of nke stock. NKE Stock Technicals —…

Nike shares on the NYSE rose to 36.36 USD, up 1.62% from the previous close, but the move sits inside a broader slide that has left the stock 11.43% lower over the past month, according to Yahoo Finance data as of 17 September 2026 20:30 WIB. The headline gain looks steadier than it is: the price remains below both the SMA20 at 38.23 and the SMA50 at 40.59, which means the stock is still trading beneath its short- and medium-term trend markers. In market terms, that usually signals that rebounds are being sold into rather than accepted as a new up leg.
The chart shows a stock that is trying to stabilize, but not yet reversing.
Trend & Price Action
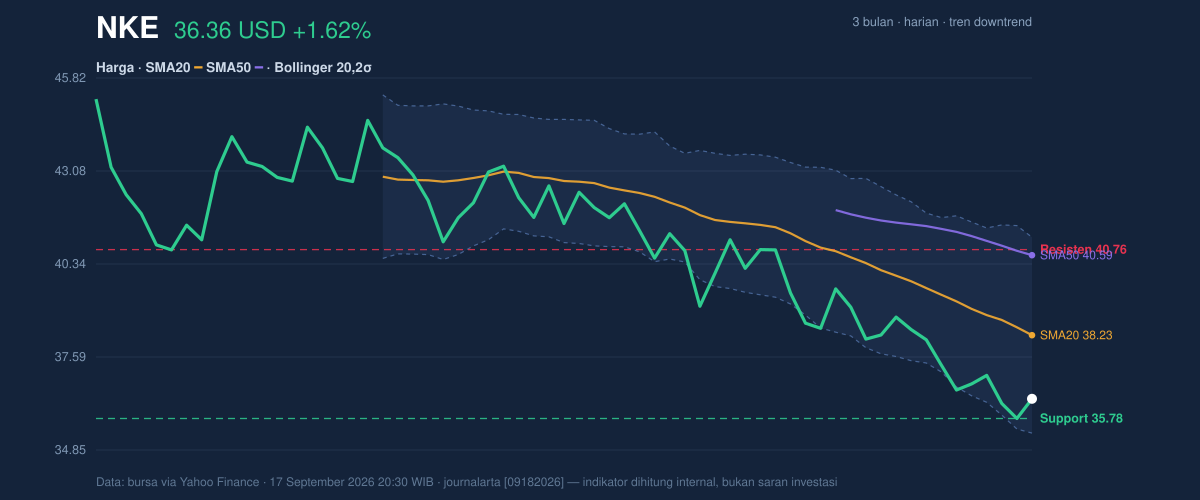
The most important signal in the price structure is not the one-day bounce; it is that Nike is still in a downtrend, with the SMA20 slope down 2.54% over 5 days. A falling 20-day average means recent prices are still drifting lower, so even when the stock lifts, the trend force underneath remains negative. The absence of a new MA-cross also matters: there is no fresh technical event showing short-term strength overtaking longer-term weakness. That keeps the chart in “repair mode,” not recovery mode.
Position within the range tells the same story. The stock is trading near the lower end of its 20-hour support at 35.78 and 20-hour resistance at 40.76, sitting at just 12% of that range. That placement usually means the market is pricing in caution, not confidence. It also sits only slightly above the 3-month low at 35.72, which is a reminder that the recent bounce has not yet reclaimed much ground from the selloff.
The stock is close to the floor, but still under pressure.
Oscillators & Momentum
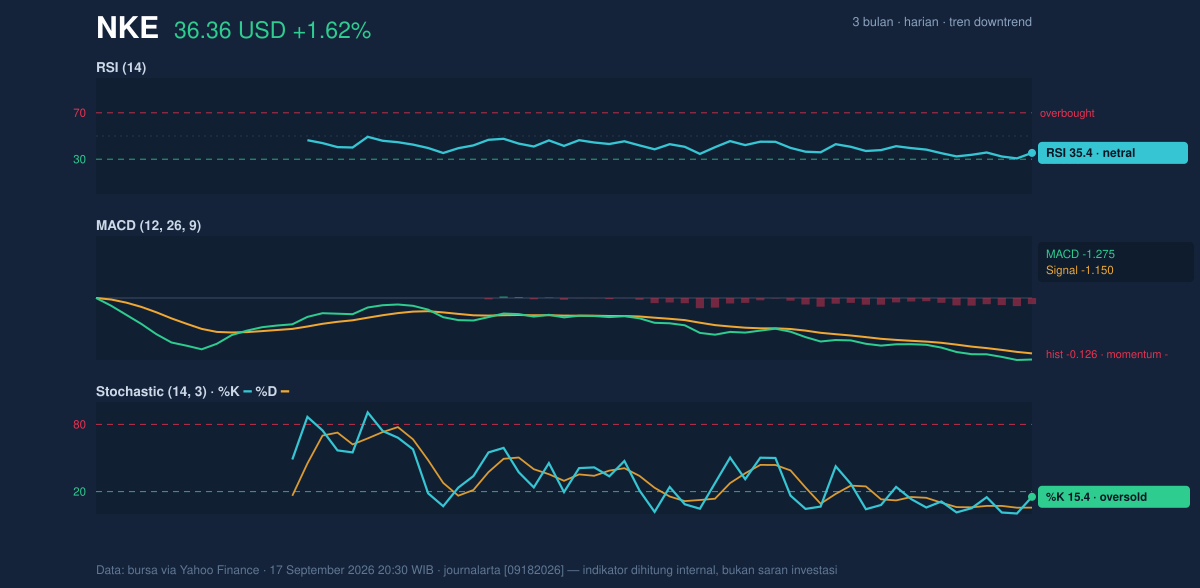
Momentum indicators show why the rebound has not yet become convincing. The RSI at 35.4 is technically neutral, but it is leaning toward the lower end of the scale, which often means sellers still have the upper hand even if the stock is no longer deeply oversold. More telling is the Stochastic %K at 15.4 and %D at 5.7: that is an oversold reading, which can flag short-term exhaustion in the decline. In plain language, the stock may be stretched on the downside, but oversold does not automatically mean a turn has started.
The MACD at -1.275, below its signal line at -1.150, with a histogram of -0.126, keeps the bearish case intact. MACD measures whether momentum is improving or deteriorating; when it stays below the signal line and the histogram remains negative, the market is still losing upside traction. Put simply, the bounce has not yet overpowered the downtrend.
That is why the chart looks tired, not healed.
Volatility & Volume
Volatility is present, but not extreme. The ATR(14) at 0.90, equal to 2.5% of price, suggests moderate volatility: daily moves are meaningful enough to matter, but not wild enough to imply panic. Bollinger Bands reinforce the idea of a stock that is compressed near the lower edge of its recent trading envelope. With the lower band at 35.35, the middle band at 38.23, and %B at 18%, Nike is trading close to the bottom of the band structure. A low %B means price is near the lower band, which often reflects weak momentum and can sometimes precede a rebound — but only if buyers start showing up with conviction.
Volume is the key check on that possibility. The latest volume of 45,402,900 was about 1.6× the 20-hour average of 28,573,785, so participation was strong. Yet OBV is down, which is the more important clue: on-balance volume tracks whether trading pressure is accumulating or leaking out over time. A rising-volume session during a downtrend can sometimes mark capitulation, but if OBV is still falling, it means the broader flow of money has not clearly turned positive. In other words, the market is active, but not necessarily constructive.
Key Levels & Scenarios
The nearest technical floor is the 35.78 support, which is also close to the 3-month low at 35.72. That cluster matters because a break below it would place the stock into fresh low territory and would suggest the recent bounce was only a pause in the decline. On the upside, the first meaningful barrier is the 38.23 SMA20, followed by the 40.76 resistance and then the 40.59 SMA50. That sequence shows why upside attempts may face layered selling: first from the short-term average, then from the resistance band, and then from the broader medium-term trend line.
If price can reclaim the 38.23 area and hold there, it would be the first sign that the market is starting to absorb supply rather than just react to oversold conditions. If it fails to hold 35.78, the chart loses its nearest support cushion and the technical tone worsens quickly.
Technical Verdict: HOLD (wait & see)
HOLD (wait & see)
- Downtrend remains intact: price is below the SMA20 at 38.23 and SMA50 at 40.59, while the SMA20 slope is -2.54% over 5 days.
- Momentum is mixed, not reversed: Stochastic is oversold, but MACD stays negative and below its signal line.
- Participation is real, but confirmation is missing: volume is 1.6× average, yet OBV is down, which weakens the case that buyers are taking control.
- Verdict invalidated if price breaks below 35.78, because that would threaten the nearby 3-month low at 35.72 and weaken the support base.
- Ideal Entry Range: 35.78 to 38.23, where support and the SMA20 sit close together.
- Exit Target: 40.76 to 41.12, using the resistance area and upper Bollinger band as the first technical ceiling.
- Stop Loss protection: below 35.72, just under the 3-month low and support cluster.
For non-traders, this means Nike is showing signs of being stretched lower, but it has not yet proven that the decline is over. “The market is active, but not yet convinced.”
Summary Data NKE
| Last price | 36.36 USD |
| Change 1 day / 5 days / 1 month | 1.62% / -0.71% / -11.43% |
| Trend / MA-cross | downtrend / none |
| SMA20 / SMA50 | 38.23 / 40.59 |
| RSI (14) / Stochastic %K | 35.4 / 15.4 |
| Bollinger %B / ATR | 18% / 0.90 |
| Support / Resistance 20 days | 35.78 / 40.76 |
| Data as of | 17 September 2026 20:30 WIB |



