Altria Stock Gains 1.67% on Friday, Testing Key Resistance
On October 30, 2026: price 78.03 USD, trend uptrend, RSI 69.8, support 67.88, resistance 78.03. technical analysis of altria stock. Altria Stock Gains — full…

Why Altria is in focus today
- Volume at 2.4× the 20-day average
- Closed at a 20-day high (78.03)
- Uptrend confirmed (5-day change 5.01%)
- Not covered by JournalArta in the last 14 days
Selected automatically from 80 NYSE (US) stocks by a technical-signal score with daily weighted randomisation — not a recommendation.
Trend & Price Action
Altria remains in an uptrend: its price is above both the 20-day simple moving average (SMA), at $73.10, and the 50-day SMA, at $70.46. The 20-day average rose 2.48% over five days, indicating that the shorter-term trend is strengthening rather than merely reflecting a single strong session. No new moving-average crossover was reported. The shares reached $78.03, matching the 20-day resistance and sitting just below the three-month high of $79.81. In practical terms, the trend is positive, but the stock is testing an area where traders may take profits or wait for evidence of a sustained breakout. The Bollinger %B reading of 99% places the price near the upper band, at $78.16. That can accompany strong momentum, though it also means the share price is stretched toward the top of its recent volatility range. The $78.03 close is both a sign of strength and a test: the next major reference above it is the $79.81 three-month high. As shown in the chart, the price is elevated relative to its moving averages and near the upper Bollinger band, while the marked support and resistance frame the levels that matter next.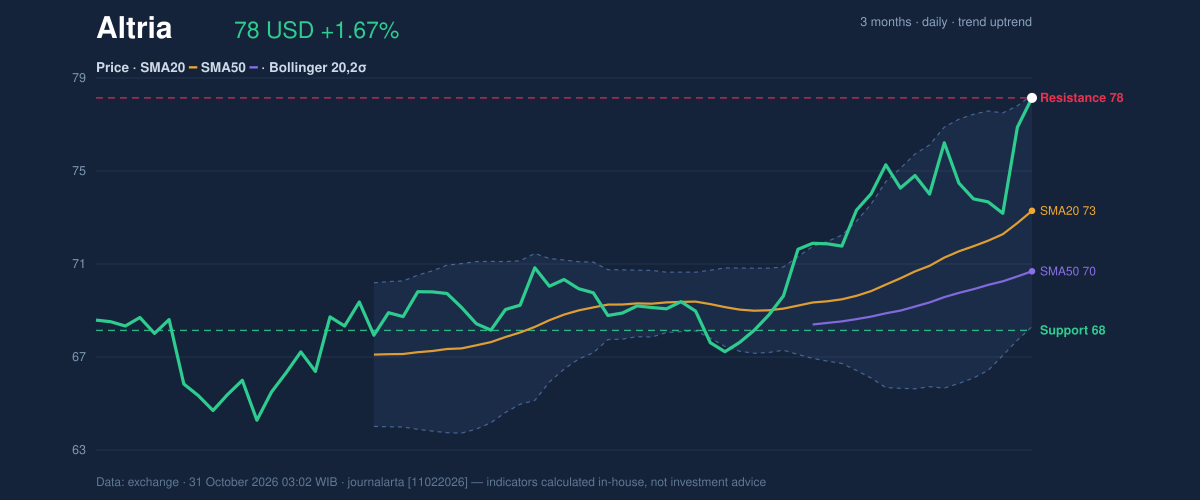
Oscillators & Momentum
Momentum indicators mostly support the rising trend, without yet showing a clear reversal signal. The RSI is 69.8 and classified as neutral in the supplied data. RSI measures the pace of recent gains and losses; a reading near 70 can indicate a forceful advance, but here it does not register as an overbought signal under the provided classification. Stochastic %K at 79.5 and %D at 71.9 are also neutral, suggesting strong recent price action without a confirmed downside turn. The MACD histogram is positive at 0.257, with MACD at 1.718 above its 1.461 signal line. The histogram’s turn positive is consistent with improving momentum, rather than evidence that the rally has already run out of force. Together with rising OBV, it strengthens the case that the move has participation behind it. RSI and Stochastic remain neutral, while the positive MACD histogram and rising OBV point to improving momentum. The chart below shows how those signals compare across the RSI, MACD and Stochastic indicators.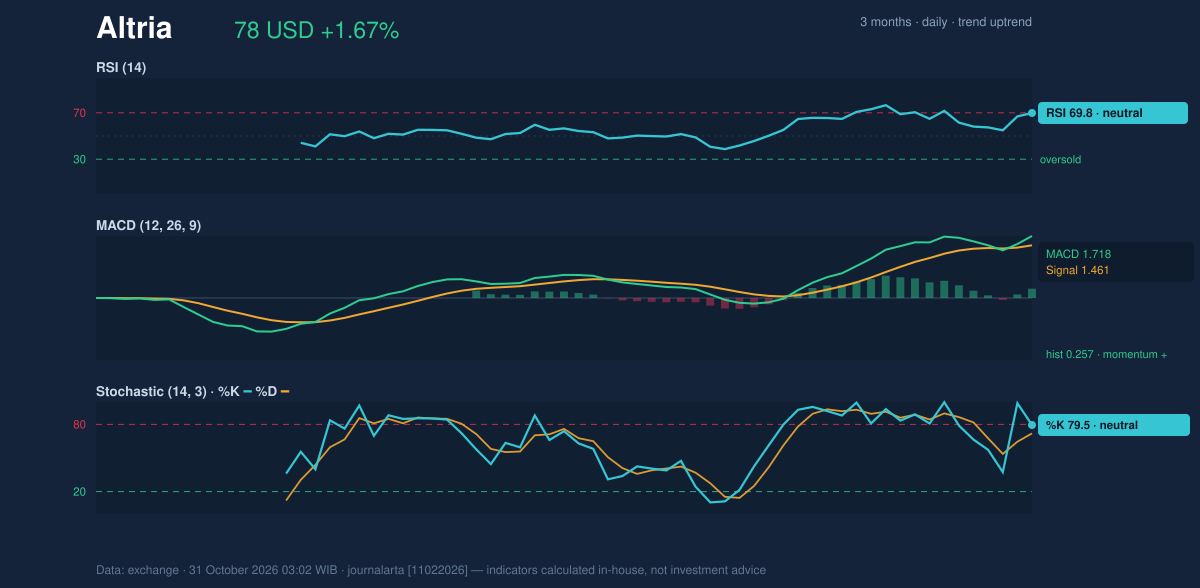
Volatility, Volume & Key Levels
Volume reached 20,516,200 shares, against a 20-day average of 8,488,705. That 2.4-times surge matters because it makes the record-range close more convincing than a move on thin trading. The Bollinger band width is 13.8%, classified as normal rather than unusually compressed or expanded. ATR, a measure of typical price movement, is $1.80, or 2.3% of the share price; this indicates moderate volatility, not a guarantee of the next move’s size. The immediate test is $78.03, the stated 20-day resistance and current close. A move above it would put $79.81, the three-month high, in focus. Failure to hold above the breakout area could bring the shares back toward the $75.33 reference level, calculated in the supplied data as price minus 1.5 times ATR. Further down, the 20-day support is $67.88, with the three-month low at $63.92. Those wider supports are trend references, not evidence that the price must revisit them.Technical Verdict: BUY
The technical bias is bullish, supported by the uptrend above the 20-day and 50-day averages, a positive MACD histogram, and rising OBV alongside volume at 2.4 times its 20-day average. The main caution is proximity to resistance: the price closed at $78.03, with the three-month high at $79.81. - Ideal entry range: $75.33–$78.03, using the supplied 1.5-times-ATR reference and 20-day resistance as boundaries. - Exit target: $79.81, the next stated resistance above the 20-day level. - Stop-loss protection: $75.33, the supplied price-minus-1.5-times-ATR level. This verdict describes a bullish technical setup, but a fall below $75.33 would invalidate it. In plain English, the indicators favor continued strength, while the shares remain close to a ceiling that could limit further gains.| Market data | Reading |
|---|---|
| Latest price | $78.03 |
| Session change | 1.67% |
| 20-day / 50-day SMA | $73.10 / $70.46 |
| 20-day support / resistance | $67.88 / $78.03 |
| Three-month high / low | $79.81 / $63.92 |
| Volume / 20-day average | 20,516,200 / 8,488,705 |
Summary Data Altria
| Last price | 78.03 USD |
| Change 1 day / 5 days / 1 month | 1.67% / 5.01% / 15.86% |
| Trend / MA-cross | uptrend / none |
| SMA20 / SMA50 | 73.10 / 70.46 |
| RSI (14) / Stochastic %K | 69.8 / 79.5 |
| Bollinger %B / ATR | 99% / 1.80 |
| Support / Resistance 20 days | 67.88 / 78.03 |
| Data as of | 31 October 2026 03:02 WIB |
Disclaimer: This technical analysis is generated automatically from exchange data and indicators calculated by JournalArta, for information and education only. The verdict and the entry, target and stop-loss levels are not investment advice or a solicitation to buy or sell any security. Investment decisions and their risks rest solely with the reader.
Track Altria stock price daily: live levels, support/resistance and our full Altria analysis history.