RSI Oversold, NOW Stock Drops 4.15% on Friday
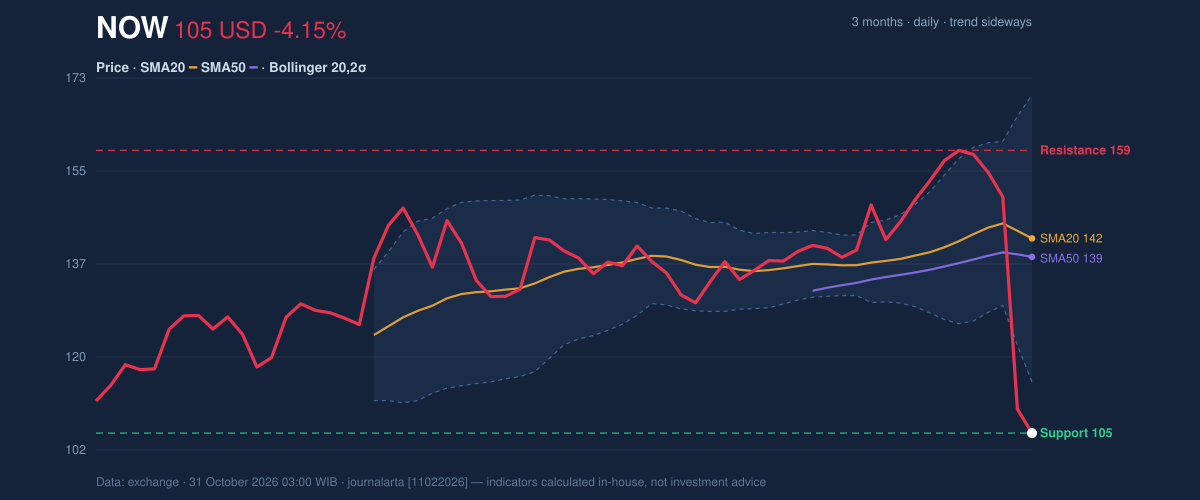
On October 30, 2026: price 105.12 USD, trend sideways, RSI 26.9, support 105.12, resistance 158.96. technical analysis of now stock. RSI Oversold — full…

Why NOW is in focus today
- Volume at 2.0× the 20-day average
- Closed at a 20-day low (105.12)
- Trading near its 3-month low (103.51)
- RSI(14) at 26.9 — oversold zone
- Not covered by JournalArta in the last 14 days
Selected automatically from 80 NYSE (US) stocks by a technical-signal score with daily weighted randomisation — not a recommendation.
Trend & Price Action
Oscillators & Momentum
Momentum indicators are deeply oversold, but they have not turned positive. The RSI is 26.9, below the commonly watched 30 threshold; the Stochastic is also oversold, with %K at 2.9 and %D at 20.3. These readings mean the sell-off has been steep relative to recent trading, not that a rebound is assured. The MACD is negative, at -1.658 against a signal line of 2.725, with a -4.383 histogram. MACD compares shorter- and longer-term price momentum; its negative histogram indicates downside momentum has intensified relative to the signal line. The technical-bias data also identify a newly negative histogram among the bearish signals. With no bullish signals recorded, the oversold readings are better treated as evidence of a stretched decline than as confirmation of a reversal. [ GRAFIK-MOMENTUM ]Volatility & Volume
Trading volume was 35,167,300 shares, or 2.0 times the 20-day average of 17,168,915. Heavy volume on a falling session suggests broad participation in the move rather than a decline occurring on unusually quiet trading. On-balance volume (OBV), which tracks whether trading volume is accumulating on advances or declines, is also falling—another sign that participation has not yet shifted toward buyers. Risk is elevated. The Bollinger Band width is 38.5% and expanding, while average true range (ATR), a measure of typical price movement, stands at $8.94, or 8.5% of the share price. Expanding bands and high ATR signal larger swings; they do not establish which direction the next move will take.Key Levels & Scenarios
The nearest reference is $105.12, the stated 20-day support, with the three-month low at $103.51. A sustained hold near those levels could slow the decline, but RSI and Stochastic being oversold are not enough on their own to establish a floor. A break below the three-month low would put the existing support structure under greater pressure. On the upside, $118.52 marks price plus 1.5 times ATR, while the lower Bollinger Band is $114.86; both offer nearer reference points for any recovery. The 20-day resistance at $158.96 and three-month high at $159.50 sit substantially higher, with the 20- and 50-day averages also above the current price. A move back above the lower band would not, by itself, reverse the bearish technical picture. [ GRAFIK-HARGA ]Technical Verdict: SELL
The bearish verdict matches the supplied technical bias. The strongest evidence is the close below both moving averages, the negative MACD histogram, and the twofold volume surge alongside a falling OBV. Oversold RSI and Stochastic readings flag the risk of a sharp counter-move, but there are no bullish signals in the supplied assessment. - Ideal entry range: $105.12–$114.86, using the 20-day support and lower Bollinger Band as reference levels. - Target price: $103.51, the three-month low and next stated downside reference. - Stop-loss protection: $158.96, above the 20-day resistance; a move beyond that level would challenge the bearish setup. - Invalidation condition: The verdict is invalidated if price breaks above $158.96. For non-traders, the indicators currently show stronger evidence of continued selling pressure than of a confirmed recovery, despite signs that the decline is stretched.Market Data
ServiceNow (NOW), NYSE | Session: Friday, October 30, 2026 | Last price: $105.12 | One-day change: -4.15% | Five-day change: -33.87% | One-month change: -21.77% | RSI(14): 26.9 | Stochastic: %K 2.9 / %D 20.3 | MACD: -1.658 | 20-day support: $105.12 | 20-day resistance: $158.96 | Three-month low/high: $103.51 / $159.50 Technical analysis describes market indicators and scenarios; it is not an investment recommendation.Summary Data NOW
| Last price | 105.12 USD |
| Change 1 day / 5 days / 1 month | -4.15% / -33.87% / -21.77% |
| Trend / MA-cross | sideways / none |
| SMA20 / SMA50 | 142.19 / 138.68 |
| RSI (14) / Stochastic %K | 26.9 / 2.9 |
| Bollinger %B / ATR | -18% / 8.94 |
| Support / Resistance 20 days | 105.12 / 158.96 |
| Data as of | 31 October 2026 03:00 WIB |
Disclaimer: This technical analysis is generated automatically from exchange data and indicators calculated by JournalArta, for information and education only. The verdict and the entry, target and stop-loss levels are not investment advice or a solicitation to buy or sell any security. Investment decisions and their risks rest solely with the reader.
Track NOW stock price daily: live levels, support/resistance and our full NOW analysis history.