Shell Stock Technicals Today: Drops 2.23%, Momentum Gains
On September 18, 2026: price 3,571.00 GBp, trend uptrend, RSI 64.7, support 3,311.00, resistance 3,652.50. technical analysis of shell stock.

Shell plc traded lower on the London Stock Exchange on 16 September, with the shares at 3,571.00 GBp after a 2.23% one-day drop, even as the broader technical picture still leans upward. The move matters because it shows the stock is pulling back from the upper part of its recent range rather than breaking the trend outright; in other words, the market is testing whether buyers still have enough conviction to defend the gains built over the past month.
Trend & Price Action
The chart shows Shell remains in an uptrend, helped by the SMA20 at 3,460.30 sitting above the SMA50 at 3,340.03, with price still trading above the SMA20. That alignment is important because it tells readers the medium-term structure is still constructive: shorter-term momentum is stronger than the longer base trend, and the absence of a new MA-cross suggests there has been no fresh technical reversal signal.
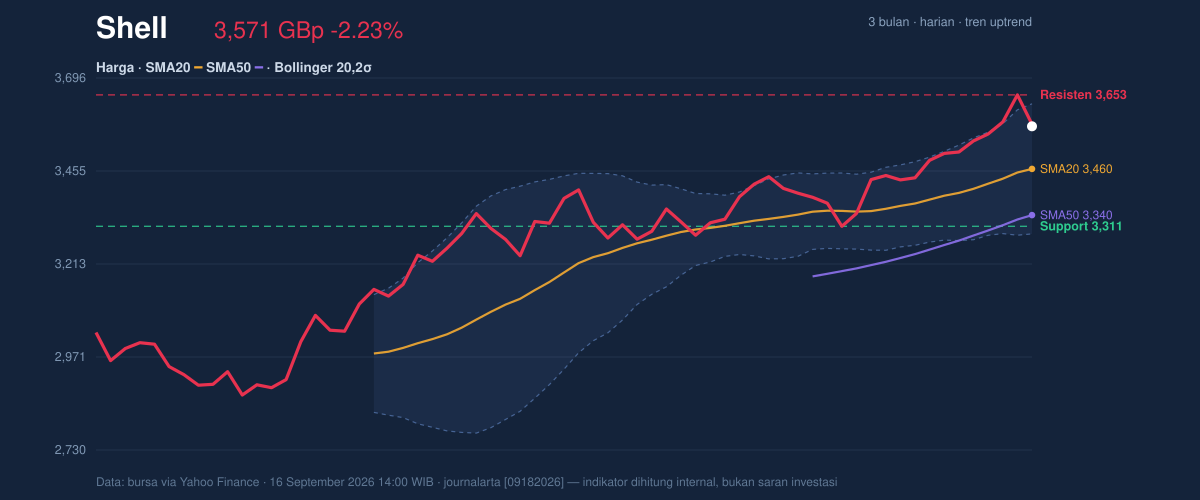
Price is also sitting near the upper end of the recent band structure, at roughly 76% of the 20-hour range, while the 20-hour resistance at 3,652.50 and the 3-month high at 3,663.50 sit close together. That clustering matters because it marks a ceiling where recent buyers have already started to hesitate; when price approaches a prior high and stalls, it often signals either consolidation or a pause before a breakout attempt, not automatic weakness. On the downside, the key 20-hour support at 3,311.00 and the SMA50 at 3,340.03 form a nearby cushion, so the current setup still has a clear floor unless that zone gives way.
Oscillators & Momentum
Momentum is positive, but not stretched enough to suggest an immediate blow-off. The RSI at 64.7 is in neutral territory and below the classic overbought threshold, which means the stock has room to extend higher without being technically overextended. The Stochastic %K at 75.7 and %D at 88.7 are both elevated, however, and that usually signals the shares are near the top of their short-term range, where advances can start to slow if fresh demand does not appear.
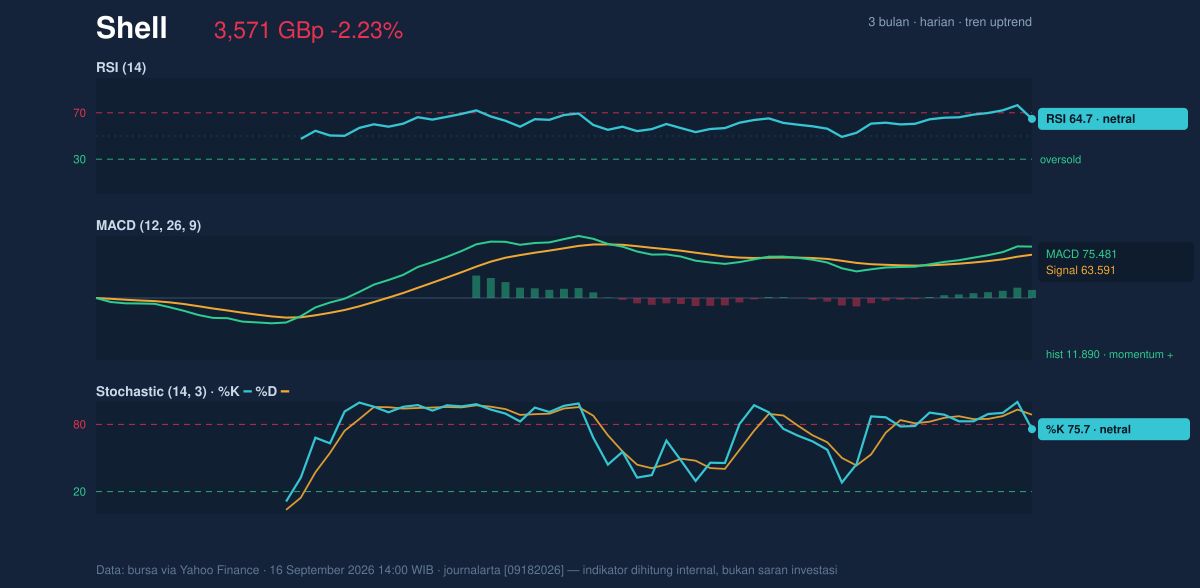
The more decisive clue comes from the MACD at 75.481 versus its signal line at 63.591, with a positive histogram of 11.890. That combination means upward momentum is still outpacing its recent average, which supports the wider uptrend even after the day’s decline. Put simply, the pullback has not yet flipped the momentum profile bearish; it looks more like a cooling phase inside a still-live advance.
Volatility & Volume
Volatility is moderate rather than explosive, with ATR(14) at 64.98, or 1.8% of price, and Bollinger bandwidth at 9.8%, described as normal. That matters because a normal band width suggests the market is not compressed into a squeeze that often precedes a violent move, nor is it in a panic expansion that would imply forced selling. The current %B at 83% shows price is trading in the upper portion of the Bollinger envelope, which is consistent with strength but also warns that the stock is closer to the upper band at 3,629.38 than to the middle band at 3,460.30.
Volume adds a more cautious note. Last trade volume was 9,222,485, below the 20-hour average of 10,647,057, or 0.9× normal, while OBV is rising. That mix is important: rising OBV says money has been accumulating over time, but lighter recent volume means today’s drop is not being backed by heavy selling pressure. In practical terms, the market is not yet showing a broad exit; it is more consistent with a pause in participation.
Key Levels & Scenarios
The immediate level to watch is the 3,571.00 GBp last price against resistance at 3,652.50. If Shell can recover back toward that ceiling with improving volume, the chart would be attempting another test of the 3-month high at 3,663.50. If it fails to reclaim the upper range and instead slips through the SMA20 at 3,460.30, the market would be signaling that the recent advance is losing traction. A deeper break below the 3,340.03 SMA50 would matter more, because that would put the trend’s support structure under pressure and raise the odds of a broader reset toward the 3,311.00 support zone.
Technical Verdict: HOLD (wait & see)
HOLD (wait & see) is the cleanest reading from the current chart. The trend is still up, MACD momentum remains positive, and OBV is rising, but price is also near the upper part of its range with Stochastic elevated and volume softer than average, which argues for patience rather than urgency.
- Ideal entry range: near 3,460.30 to 3,340.03, where the SMA20 and SMA50 sit as support.
- Exit target: 3,652.50 to 3,663.50, matching the stated resistance and 3-month high.
- Stop loss protection: below 3,311.00, the 20-hour support level.
The verdict is invalidated if price breaks below 3,311.00, because that would mean the current support shelf has failed.
In plain English, Shell still looks technically healthy, but the chart is asking for proof before the next leg higher. “The market is still giving the benefit of the doubt — but only just.”
Summary Data Shell
| Last price | 3,571.00 GBp |
| Change 1 day / 5 days / 1 month | -2.23% / 1.91% / 5.40% |
| Trend / MA-cross | uptrend / none |
| SMA20 / SMA50 | 3,460.30 / 3,340.03 |
| RSI (14) / Stochastic %K | 64.7 / 75.7 |
| Bollinger %B / ATR | 83% / 64.98 |
| Support / Resistance 20 days | 3,311.00 / 3,652.50 |
| Data as of | 16 September 2026 14:00 WIB |