BP Stock Analysis: Gains 2.63%, Momentum Weakens
On September 24, 2026: price 557.20 GBp, trend uptrend, RSI 47.4, support 514.50, resistance 580.30. technical analysis of bp stock. BP Stock Analysis — full…

BP plc is trading higher on the day, but the tape is still asking a bigger question: whether the recent bounce can turn into sustained follow-through or fade back into the middle of its range.
At 557.20 GBp, BP.L is up 2.63% from the previous close of 542.90, according to market data via Yahoo Finance. That move matters because it lifts the shares back above the short-term trend line, yet the stock is still below the upper boundary of its recent trading band. In plain terms: the market is recovering, but not yet convincing enough to call it a clean breakout.
Trend & Price Action
The broader structure remains constructive. BP is in an uptrend, with the SMA20 at 547.69 still rising at 0.61% over 5 days, and the share price sitting above the SMA20 as well as the SMA50 at 537.85. That alignment usually signals that buyers still have the short- to medium-term advantage.
What is more important, though, is what the chart is not showing: there is no fresh MA-cross. That means the trend is not being reinforced by a new moving-average crossover, so the move is still dependent on price holding above the short-term averages rather than on a new technical trigger.
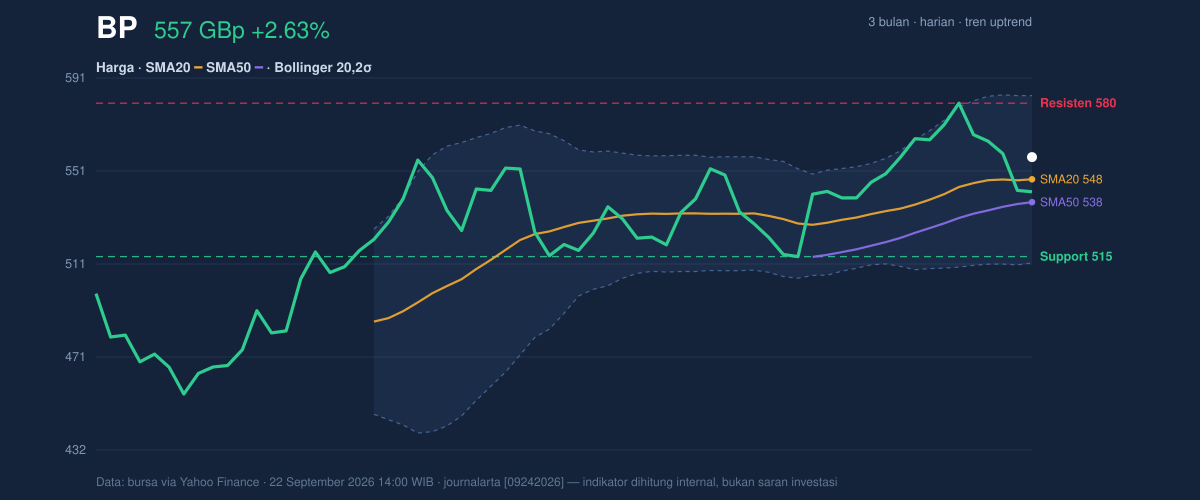
The stock is also trading in the upper part of its recent range, at about 65% of the 20-hour range, with 20-hour support at 514.50 and 20-hour resistance at 580.30. That positioning is constructive, but it also leaves room for hesitation: shares are not yet pressing through resistance, and the market has already tested the idea of a rebound for one month, with the share price up 4.40% over that period but down 3.98% over five days. That mix usually signals a market that is trending upward in the bigger picture while still absorbing short-term selling.
The longer range also matters. BP is trading well above the 3-month low of 450.60, but still below the 3-month high of 582.60. That places the shares in the upper half of the wider range without yet reaching the top, which is often where momentum tests become more visible.
Oscillators & Momentum
The momentum picture is more mixed than the trend. The RSI at 47.4 is neutral, which means the stock is neither overbought nor oversold. That matters because it suggests the recent rise has not yet stretched sentiment to an extreme. In other words, the rally is not obviously exhausted, but neither is it strongly supported by momentum breadth.
The Stochastic %K at 33.4 and %D at 42.8 are also neutral, though they sit in a softer zone than price action alone would imply. Stochastic is useful for spotting turns in short-term momentum, and here it suggests BP is recovering, but still needs proof that buyers can sustain control.
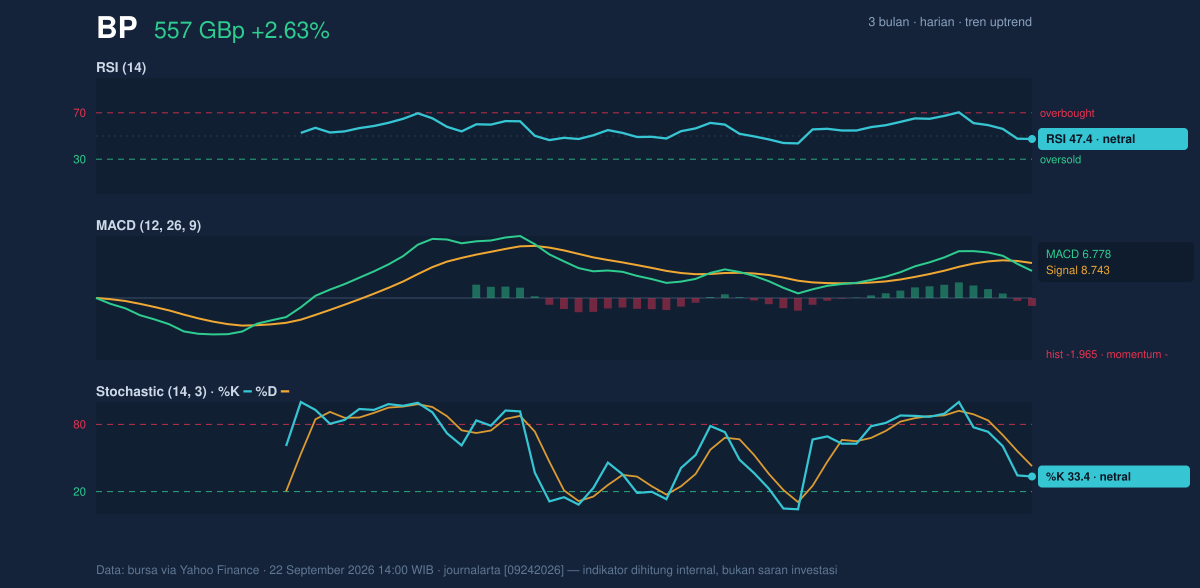
The clearest warning comes from the MACD at 6.778 versus its signal line at 8.743, leaving a histogram of -1.965. That negative histogram means near-term momentum is still lagging the trend. This is not a collapse signal, but it does show the rally has not yet regained full internal strength. A stock can sit above its moving averages and still struggle if MACD remains below the signal line; that usually points to a market where price is stable, but acceleration is lacking.
Volatility & Volume
Volatility is moderate rather than extreme. BP’s ATR(14) is 16.40, equal to 2.9% of price, which suggests the stock can move meaningfully without being unusually erratic. The Bollinger Bands are also telling a balanced story: the upper band is 583.57, the middle band is 547.69, and the lower band is 511.82, with %B at 63% and a 13.1% band width described as normal.
That combination usually means the stock is not in a squeeze, where a sharp breakout becomes more likely, nor is it in a volatility spike that often marks emotional trading. Price sitting above the middle band and at 63% of the Bollinger range suggests the market is leaning upward, but still has room to either challenge the upper band or drift back toward the center.
Volume adds an important wrinkle. Last volume was 28,385,509, well below the 20-hour average of 46,734,876, or about 0.6x normal. Lower-than-average volume on an up day can mean the advance is not yet broadly confirmed by participation. Still, OBV is rising, which is a useful counterweight: on-balance volume tracks whether money flow is accumulating over time, and a rising OBV suggests buyers have been gradually more active even if the latest session was quieter than usual.
Key Levels & Scenarios
The chart’s immediate battle lines are clear. Support at 547.69 — the SMA20 and Bollinger middle band — is the first level to watch, because it marks the zone where the current bounce would either be validated or questioned. Below that, 514.50 support is the more important floor, since a break there would expose the lower Bollinger band at 511.82 and weaken the current uptrend structure.
On the upside, 580.30 resistance is the near-term ceiling, closely followed by the 583.57 upper Bollinger band and the 582.60 three-month high. A move through that cluster would be more than a routine daily gain; it would indicate the stock is pushing into the top of its recent range with momentum confirmation still needed.
The core signal is that BP remains technically constructive above its short-term averages, but the negative MACD histogram and lighter volume show the advance is not yet fully confirmed.
Technical Verdict: HOLD (wait & see)
HOLD (wait & see)
- Reason 1: Price is above the SMA20 and SMA50, which keeps the trend positive.
- Reason 2: RSI 47.4 and Stochastic 33.4 / 42.8 are neutral, so momentum is not stretched, but also not strongly decisive.
- Reason 3: MACD below signal with a -1.965 histogram and volume at 0.6x normal argue for patience rather than conviction.
- Verdict invalidated if price falls below 514.50, which would break the 20-hour support and weaken the current trend structure.
- Ideal Entry Range: 547.69 to 557.20 GBp
- Exit Target (Target Price): 580.30 to 583.57 GBp
- Stop Loss protection: below 514.50 GBp
For non-traders, this means BP is holding its recovery, but the market has not yet shown enough strength to prove the next leg higher. The next scheduled test is whether shares can challenge 580.30 and the 583.57 band edge.
Summary Data BP
| Last price | 557.20 GBp |
| Change 1 day / 5 days / 1 month | 2.63% / -3.98% / 4.40% |
| Trend / MA-cross | uptrend / none |
| SMA20 / SMA50 | 547.69 / 537.85 |
| RSI (14) / Stochastic %K | 47.4 / 33.4 |
| Bollinger %B / ATR | 63% / 16.40 |
| Support / Resistance 20 days | 514.50 / 580.30 |
| Data as of | 22 September 2026 14:00 WIB |

