Visa Stock Technicals Today: Gains 1.79%, Momentum Weakens
On September 25, 2026: price 367.98 USD, trend sideways, RSI 48.4, support 361.52, resistance 383.90. technical analysis of visa stock.

Visa slipped to 367.98 USD in New York trading, up 1.79% on the day but still below its short-term average, a combination that says the shares are trying to stabilize without yet reclaiming control. The move matters because it came while the broader pattern remains sideways, with the stock trading in the lower part of its recent range and volume running below normal, a sign that buyers have not yet shown the conviction usually needed to turn a bounce into a trend.
Trend & Price Action
As shown in the chart, Visa is sitting below the SMA20 at 373.13 and only marginally above the SMA50 at 367.81, which puts the stock in a narrow zone where direction is still undecided. That matters because the 20-day average is drifting lower, with a -0.42% slope over 5 days, so the near-term trend is not accelerating upward; it is flattening and leaning soft. In practical terms, that means each rally is being met by supply before it can build momentum, while the stock’s position at 29% of its 20-hour range shows it is still closer to the floor than the ceiling of the recent trading band.
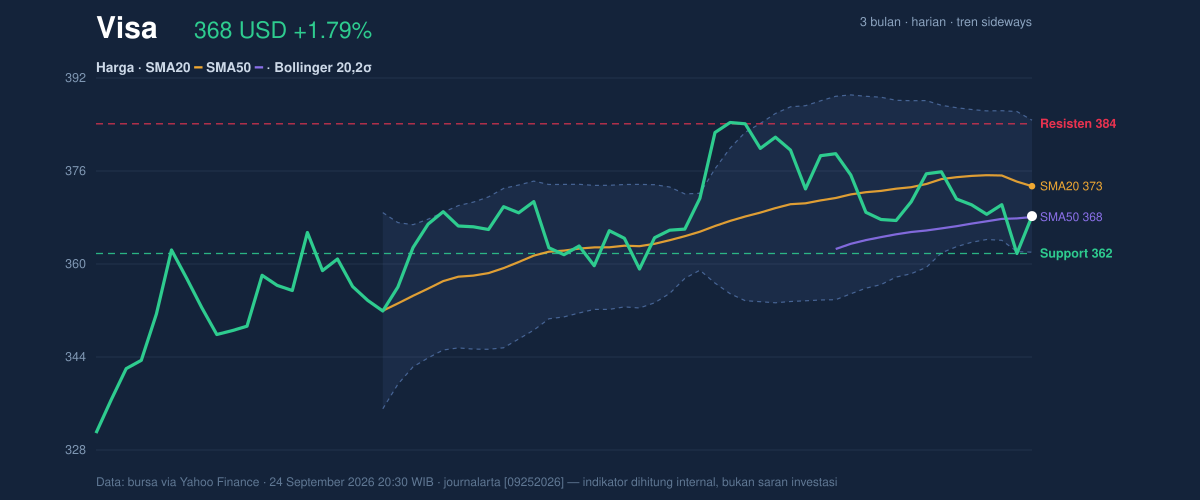
The broader range also frames the story. Visa’s 3-month high of 385.57 remains close enough to act as a ceiling, but the more immediate issue is the 20-hour support at 361.52, which is only a few dollars below the latest price. When a stock hovers near support while remaining under its short average, it often signals a market that is waiting for a catalyst rather than one already in a committed advance.
Oscillators & Momentum
The momentum picture is mixed to weak. RSI at 48.4 is neutral, which means the stock is neither stretched on the upside nor washed out on the downside. That is important because neutral RSI often reflects indecision, not strength; it tells readers the market has room to move either way, but it has not chosen a side. The Stochastic reading of 35.9 / 23.1 is also neutral, though the lower %D line suggests recent pressure has eased somewhat without confirming a clean reversal.
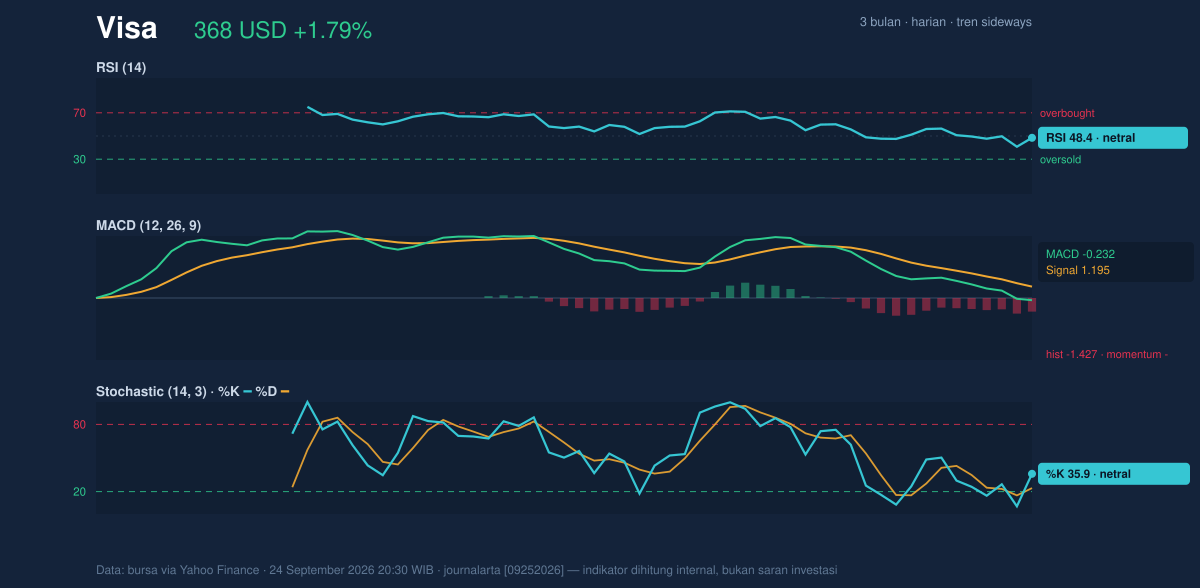
The most telling signal is the MACD at -0.232, with the signal line at 1.195 and a histogram of -1.427. In plain language, that means short-term momentum is still lagging behind the longer rhythm of the price, and the gap between the MACD line and its signal line is pointing to negative pressure rather than a fresh uptrend. This is the kind of setup that can improve quickly if price pushes through resistance, but until then it argues for caution: the stock has stopped falling sharply, yet it has not generated the internal force that usually confirms a stronger rebound.
Volatility & Volume
Visa’s Bollinger Band width of 6.1% is relatively tight, and the chart shows the bands are compressing. That combination often matters more than the direction of the latest daily move, because a squeeze can precede a larger breakout once the market commits to a side. The catch is that compression does not predict direction; it only says the stock is storing energy. With %B at 27%, price is sitting in the lower part of the band structure, which keeps the near-term tone cautious even as the setup becomes more reactive.
Volatility is also subdued in absolute terms. ATR(14) at 5.49, or 1.5% of price, indicates the stock is not swinging widely right now. Low ATR can make moves look orderly, but it also means any breakout needs follow-through to matter. That is where volume becomes critical, and here the message is not encouraging: last volume was 4,415,500, below the 20-day average of 6,006,750, or 0.7x normal. In other words, the latest rise happened without broad participation, and OBV is falling, which suggests the balance of traded volume has favored distribution rather than accumulation.
Key Levels & Scenarios
The immediate map is clear. Support at 361.52 is the first line that matters, while resistance at 383.90 sits just under the 3-month high of 385.57. The stock’s current placement near the lower third of the range means it has more room to recover than to extend without friction, but it also means a loss of support could quickly invite a retest of the lower end of the recent range.
Because the Bollinger bands are tight and the trend is sideways, the next meaningful move is likely to come from a break of one of those boundaries. A push above 383.90 would improve the technical tone by showing that price can reclaim the upper band area and challenge the recent high. By contrast, a failure to hold 361.52 would confirm that the current stabilization attempt has failed and that the market is still under pressure from sellers.
Technical Verdict: HOLD (wait & see)
HOLD (wait & see) fits best because the stock is sitting between support and resistance, while momentum remains negative and volume confirmation is weak. MACD is still below its signal line, RSI is neutral rather than strong, and OBV is falling, which together argue that the latest bounce has not yet earned trust. At the same time, the Bollinger squeeze and low ATR show that a larger move could develop soon, but the direction is not yet confirmed.
- Ideal Entry Range: 361.52 to 367.81, where support and the SMA50 cluster.
- Exit Target: 383.90 to 385.57, the resistance zone and recent 3-month high area.
- Stop Loss protection: below 361.52, because that level is the nearest support and the current range floor.
This means Visa is not showing enough technical strength to call the move decisive, but it is close enough to a volatility break that traders will be watching the next push or pullback very closely. “The market is waiting,” one trader might say, “and the next clean break will tell us who is in charge.”
Summary Data Visa
| Last price | 367.98 USD |
| Change 1 day / 5 days / 1 month | 1.79% / -0.80% / -4.21% |
| Trend / MA-cross | sideways / none |
| SMA20 / SMA50 | 373.13 / 367.81 |
| RSI (14) / Stochastic %K | 48.4 / 35.9 |
| Bollinger %B / ATR | 27% / 5.49 |
| Support / Resistance 20 days | 361.52 / 383.90 |
| Data as of | 24 September 2026 20:30 WIB |


