UNH Momentum Weakens: Stock Gains 1.83% (Oktober 5, 2026)
On Oktober 5, 2026: price 371.90 USD, trend downtrend, RSI 40.4, support 365.20, resistance 400.84. technical analysis of unh stock. UNH Momentum Weakens —…

UnitedHealth Group shares edged up to 371.90 on the NYSE, after a 1.83% daily gain that still leaves the stock below its short- and medium-term trend markers. The move matters less for its size than for where it happened: UNH is trading under its SMA20 at 378.78 and well below its SMA50 at 393.74, a setup that tells the market is still pricing in caution even after the latest rebound.
Trend & Price Action
The chart shows a stock that is trying to stabilize, but not yet proving a reversal. UNH remains in a downtrend, and the SMA20 slope of -1.59% over 5 days confirms the near-term trend is still pointing lower. That slope is important because it indicates the average price over the last month is still falling, so a one-day bounce does not yet change the broader message.
The latest close also sits in the lower part of its recent trading band. With support at 365.20 and resistance at 400.84, the stock is positioned at roughly 19% of that range, closer to support than resistance. That placement suggests the market has not fully rejected the recent decline, but it has also not reclaimed enough ground to shift momentum decisively.
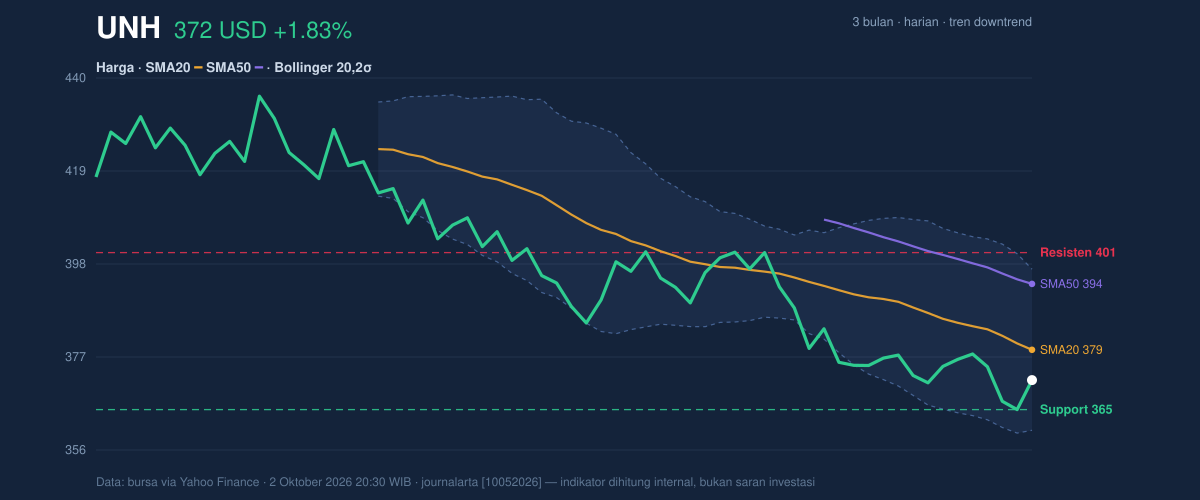
The broader range adds context. UNH is still above its 3-month low of 362.60, but far below its 3-month high of 461.62. In plain terms, the stock is no longer near the lower extreme, yet it remains distant from the levels that would signal renewed strength. The absence of a fresh MA-cross also matters: without a new crossover between key moving averages, the chart lacks the kind of technical confirmation that often accompanies a trend change.
Oscillators & Momentum
Momentum indicators are mixed, and that is the main reason the stock does not yet look fully repaired. RSI at 40.4 is neutral, but it sits below the midpoint that traders often watch as a dividing line between weak and strong momentum. That means the stock is not oversold in a panic sense, but it is still operating with limited buying pressure.
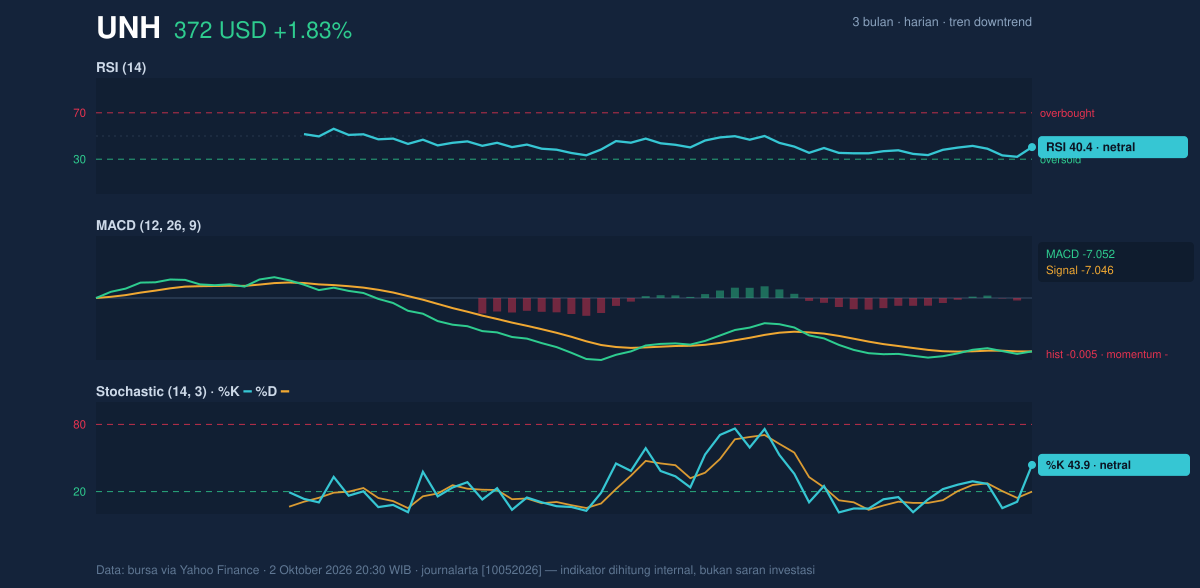
The Stochastic %K at 43.9 and %D at 20.0 also read as neutral, but the gap between them shows short-term momentum has improved from very weak levels without fully turning bullish. Stochastic is useful because it compares the current price to the recent range; here, it suggests the stock has moved off the floor, yet not enough to claim a sustained upswing.
The clearest message comes from MACD. MACD at -7.052, with the signal line at -7.046 and a histogram of -0.005, indicates momentum is still slightly negative. The histogram is nearly flat, which can mean the downtrend is losing force, but it has not crossed into positive territory. That is a subtle but important distinction: the selling pressure appears to be easing, not reversing.
Volatility & Volume
Volatility is active but not extreme. ATR at 7.34, or about 2.0% of price, points to moderate daily movement. That matters because a stock with this profile can still swing enough to test nearby support or resistance, but the current setup does not imply panic conditions or a volatility breakout. The Bollinger Band width of 9.7% is also described as normal, which suggests the stock is not in a squeeze that often precedes a sharp expansion, nor in an overstretched condition that would typically invite immediate mean reversion.
Price location inside the bands is also informative. With %B at 31%, UNH is trading in the lower portion of its Bollinger envelope, closer to the lower band at 360.49 than the upper band at 397.07. That positioning often signals a market that is still under pressure, even if it is no longer at the weakest point of the range.
Volume tells a more constructive story. The latest volume of 3,306,900 was only 0.7× normal versus the 20-day average, which means the rebound came without heavy participation. That limits the strength of the move. Still, OBV is rising, and that is a useful counterpoint: on-balance volume tracks whether money is quietly accumulating or leaving the stock. A rising OBV while price remains subdued can hint that buyers are starting to absorb supply, even if they have not yet forced a breakout.
Key Levels & Scenarios
The chart’s key levels frame the next test. 365.20 is the immediate support to watch, while 378.78 is the first moving-average hurdle and 400.84 is the main resistance zone. Above that, the upper Bollinger band at 397.07 adds another near-term ceiling, reinforcing that the stock must reclaim multiple layers before the technical picture improves materially.
What the signals mean is straightforward: if UNH can hold above support and push back through the SMA20 at 378.78, the chart would begin to look less fragile. If it fails to hold 365.20, the market would likely be signaling that the recent bounce was only a pause inside a broader downtrend. The fact that price is still under the SMA50 at 393.74 keeps the medium-term bias cautious.
Technical Verdict: HOLD (wait & see)
HOLD (wait & see)
- MACD remains slightly negative, so momentum has not confirmed a durable turn.
- Price is below SMA20 and SMA50, keeping the stock in a downtrend despite the rebound.
- Volume is below average, which weakens the case that the latest move reflects broad conviction.
Verdict invalidated if price breaks below 365.20, because that would put the stock through immediate support and back toward the lower end of the 3-month range.
- Ideal Entry Range: 365.20 to 378.78
- Exit Target: 393.74 to 400.84
- Stop Loss Protection: below 360.49
In plain English: the stock is trying to recover, but the chart still needs proof before the trend can be called repaired.
Summary Data UNH
| Last price | 371.90 USD |
| Change 1 day / 5 days / 1 month | 1.83% / -1.25% / -7.24% |
| Trend / MA-cross | downtrend / none |
| SMA20 / SMA50 | 378.78 / 393.74 |
| RSI (14) / Stochastic %K | 40.4 / 43.9 |
| Bollinger %B / ATR | 31% / 7.34 |
| Support / Resistance 20 days | 365.20 / 400.84 |
| Data as of | 2 Oktober 2026 20:30 WIB |
Track UNH stock price daily: live levels, support/resistance and our full UNH analysis history.