Glencore Stock Drops 0.80% on Wednesday, Death Cross Pressure
On October 7, 2026: price 568.90 GBp, trend sideways, RSI 50.7, support 542.20, resistance 605.50. technical analysis of glencore stock.
Why Glencore is in focus today
- Fresh death cross: SMA20 crossed below SMA50
- Not covered by JournalArta in the last 14 days
Selected automatically from 16 LSE (UK) stocks by a technical-signal score with daily weighted randomisation — not a recommendation.
Trend & Price Action
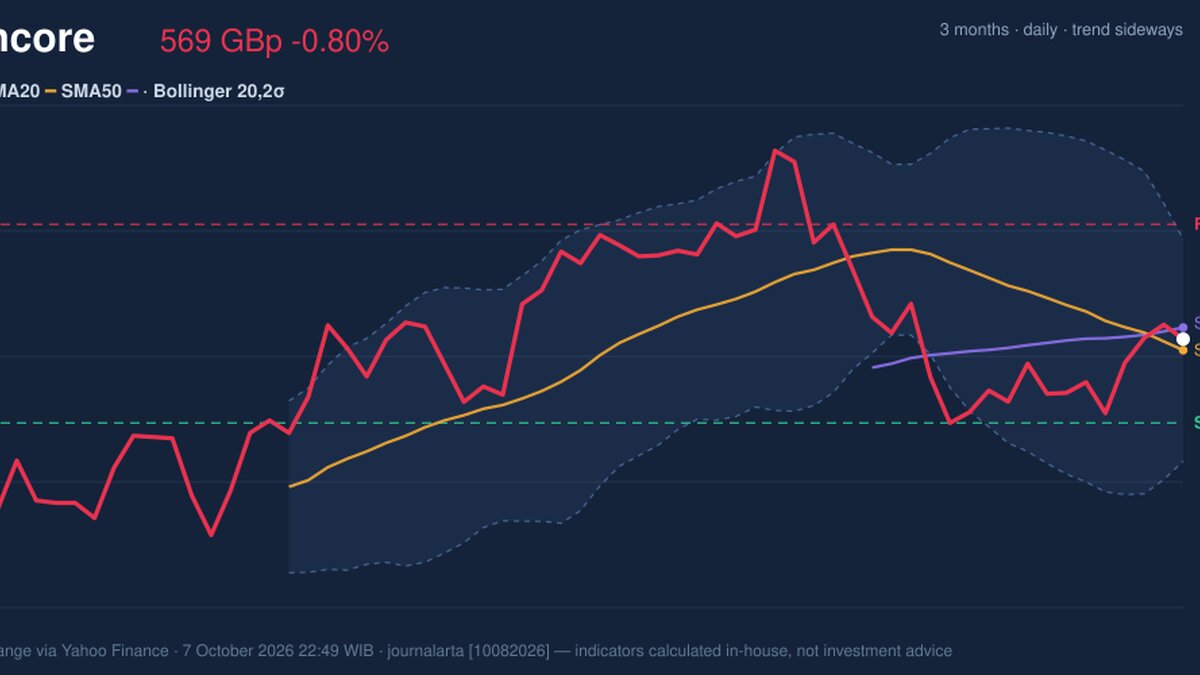
The shares remain just above their 20-day moving average, or SMA20, at 565.37 GBp, but below the 50-day average at 572.63 GBp. The SMA20 has crossed below the SMA50—a death cross that signals weakening relative trend, not a guarantee of further declines. Its slope has fallen 2.14% over five trading days, while the broader trend is sideways: the recent bounce has not yet undone the weaker monthly performance. The chart places the share price at 42% of its 20-trading-day range, between support at 542.20 GBp and resistance at 605.50 GBp. That leaves room on either side, but a move through either boundary would offer a clearer signal than the current position. As shown in the chart, the price is near the Bollinger midpoint rather than at an extreme.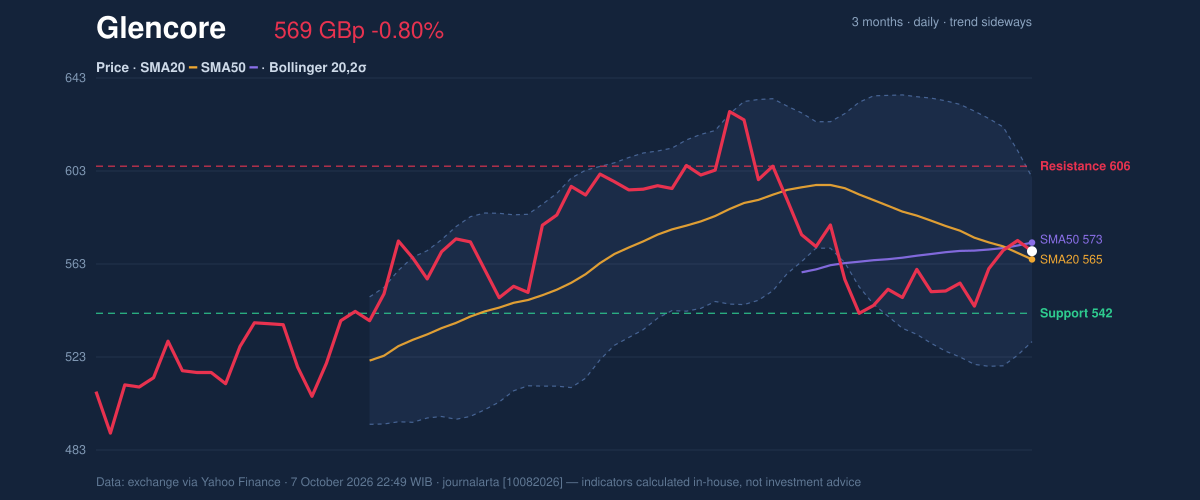
Oscillators & Momentum
Momentum indicators are mixed. The RSI is neutral at 50.7, consistent with a market that has not established strong directional momentum. The MACD remains below zero at -3.761, but sits above its signal line at -4.894, producing a positive histogram of 1.133. That combination suggests short-term momentum has improved even though the broader MACD reading remains negative. The Stochastic is overbought, with %K at 97.7 and %D at 83.2. This does not itself predict a fall; it indicates that recent gains have been rapid enough to leave the measure near its upper extreme, raising the chance that momentum could pause. The positive MACD histogram offers a counterweight, but the death cross means the rebound has not yet confirmed a broader trend reversal.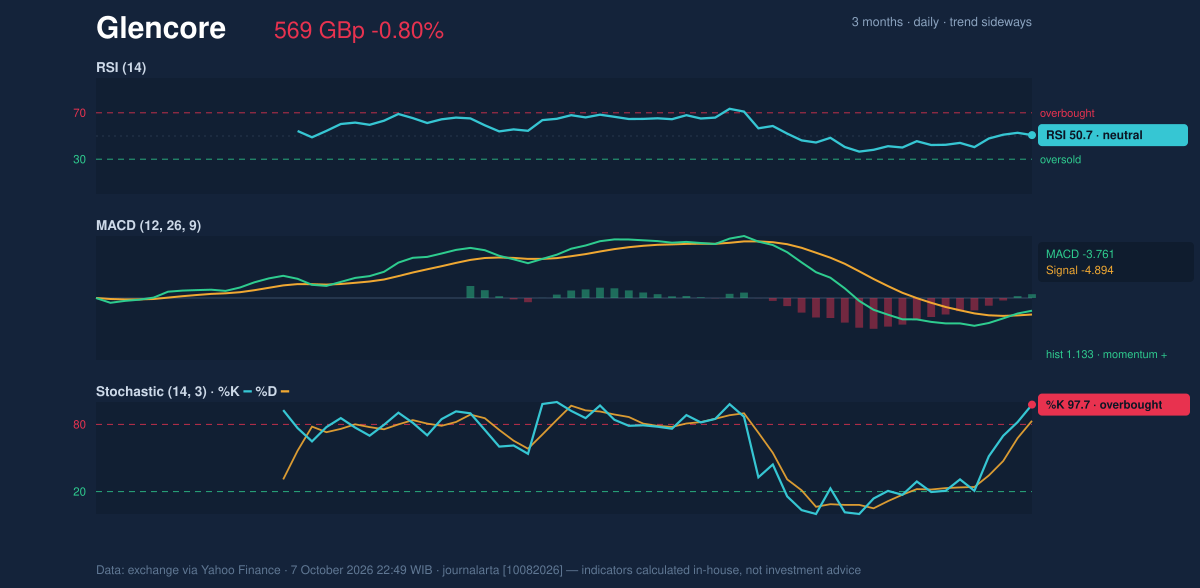
Volatility & Volume
The share price sits slightly above the Bollinger middle band at 565.37 GBp, with %B at 55% and a normal band width of 12.5%. The bands are not signaling an unusually compressed market or a sharp volatility expansion. Still, the ATR is 56.24 GBp, or 9.9% of the share price, indicating substantial typical price movement; traders should therefore treat nearby levels as zones, not precise turning points. The latest reported volume was 140, against a 20-day average of 31,180,326, classified in the data as thin. That reading offers little confirmation of the day’s move. OBV, a running measure of whether volume is flowing more on rising or falling sessions, is rising, but the unusually low latest volume makes that positive signal less persuasive on its own.Key Levels & Scenarios
The first test is whether the shares can hold above the SMA20 at 565.37 GBp and reclaim the SMA50 at 572.63 GBp. A sustained move above the 50-day average would weaken the immediate bearish signal; a failure to hold the 20-day average would put 542.20 GBp support back in focus. Above the range, resistance at 605.50 GBp is the key level, with the three-month high at 633.90 GBp providing broader context rather than an immediate target. The three-month low is listed as 0.00 GBp in the supplied data, which is not a useful trading reference. The nearer support and resistance levels provide a more relevant framework for assessing the current sideways structure.Technical Verdict: HOLD (wait & see)
The indicators point to conflicting forces: the death cross and falling SMA20 slope caution against reading the recent five-day gain as a confirmed recovery; the MACD histogram is positive, while neutral RSI and rising OBV provide some support. Overbought Stochastic and thin latest volume, however, leave the rebound without strong confirmation. - Ideal Entry Range: 565.37–572.63 GBp, around the SMA20–SMA50 zone, subject to price stabilising. - Exit Target (Target Price): 605.50 GBp, the 20-trading-day resistance. - Stop Loss protection: 542.20 GBp, the 20-trading-day support. - Invalidation: The hold-and-wait verdict is invalidated if the price falls below 542.20 GBp. For non-traders, the mixed signals favour waiting for the share price to show whether it can hold support or regain its longer moving average.Summary Data Glencore
| Last price | 568.90 GBp |
| Change 1 day / 5 days / 1 month | -0.80% / 2.47% / -9.03% |
| Trend / MA-cross | sideways / death |
| SMA20 / SMA50 | 565.37 / 572.63 |
| RSI (14) / Stochastic %K | 50.7 / 97.7 |
| Bollinger %B / ATR | 55% / 56.24 |
| Support / Resistance 20 days | 542.20 / 605.50 |
| Data as of | 7 October 2026 22:49 WIB |
Disclaimer: This technical analysis is generated automatically from exchange data (via Yahoo Finance) and indicators calculated by JournalArta, for information and education only. The verdict and the entry, target and stop-loss levels are not investment advice or a solicitation to buy or sell any security. Investment decisions and their risks rest solely with the reader.
Track Glencore share price daily: live levels, support/resistance and our full Glencore analysis history.