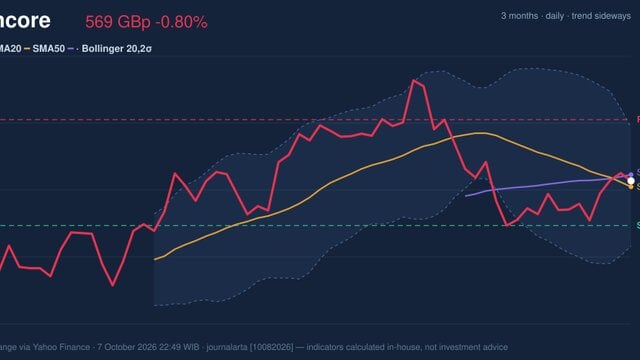
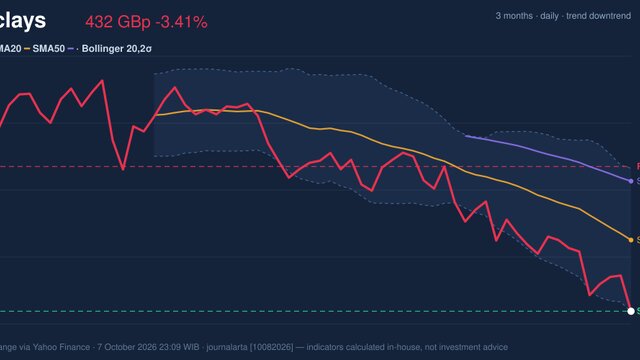
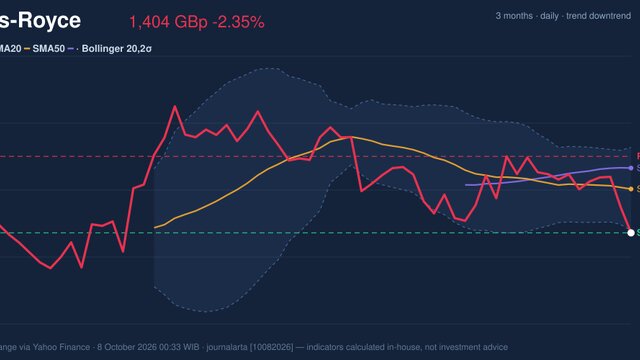
Momentum Weakens, GSK Stock Gains 1.42% on Wednesday
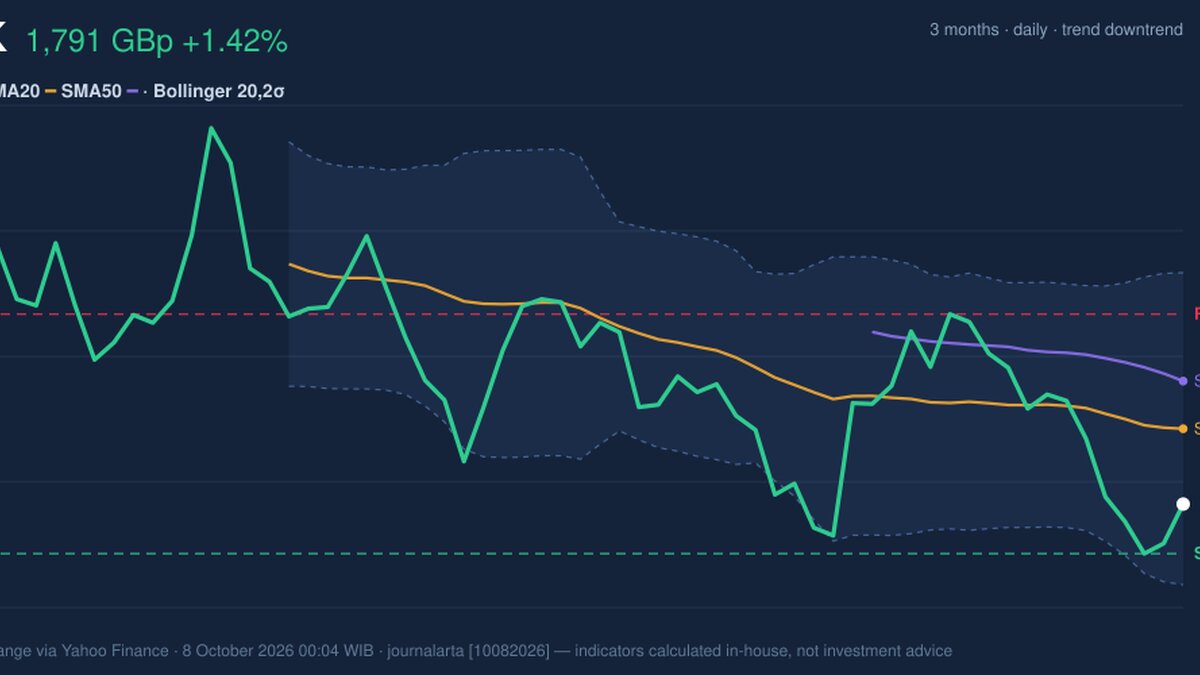
On October 7, 2026: price 1,790.50 GBp, trend downtrend, RSI 40.3, support 1,759.00, resistance 1,911.00. technical analysis of gsk stock.
Why GSK is in focus today
- Downtrend extending (5-day change -2.27%)
- Not covered by JournalArta in the last 14 days
Selected automatically from 16 LSE (UK) stocks by a technical-signal score with daily weighted randomisation — not a recommendation.
Trend & Price Action
The shares trade below the SMA20 at 1,838.30 GBp and the SMA50 at 1,868.53 GBp. A simple moving average tracks the average price over a set period; when the share price sits beneath both, it indicates that recent trading remains weaker than those longer reference points. There has been no new moving-average crossover to suggest a confirmed change in direction. The 20-day average has fallen 0.70% over five days, reinforcing the downtrend. GSK is near the lower part of its stated 20-day range: support is 1,759.00 GBp and resistance is 1,911.00 GBp, with the price at 21% of that range. The position leaves room for a technical bounce, but does not by itself establish a reversal.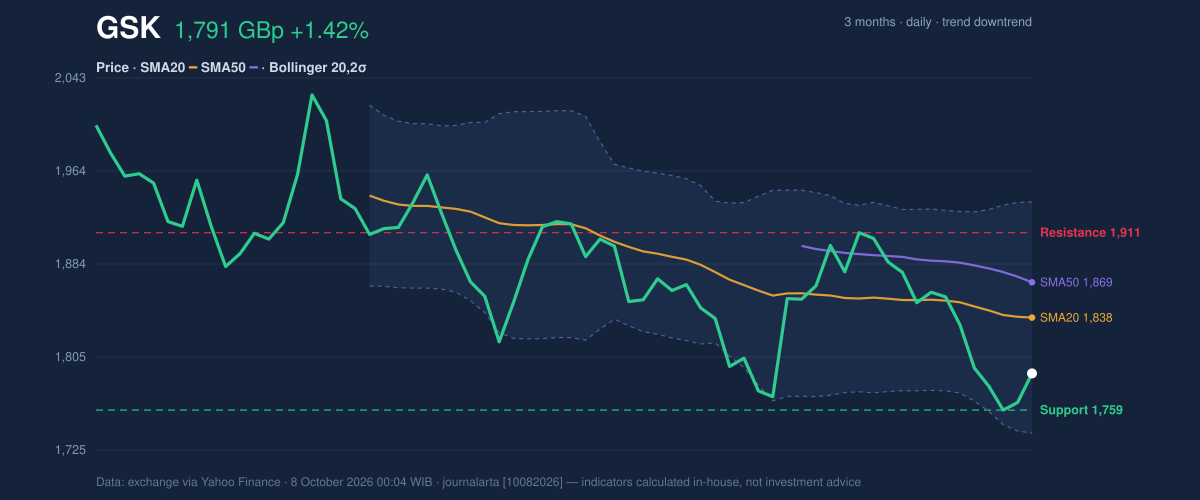
Oscillators & Momentum
Momentum readings are mixed, with the broader signal still leaning negative. The RSI is 40.3, in neutral territory. The Relative Strength Index measures the pace of recent gains and losses; this reading is below the midpoint but does not indicate an extreme condition. The Stochastic reading is more stretched: %K at 93.4 is overbought, while %D is 36.7. Stochastic compares a closing price with its recent trading range. The sharp gap between the two lines can signal a short-term surge that may be vulnerable to fading, particularly when the wider trend is down. The MACD is negative at -24.363, below its -15.678 signal line, with a negative histogram of -8.685. MACD compares moving averages to gauge momentum; these readings suggest downside pressure remains in place rather than confirming the latest one-day rise as a durable shift.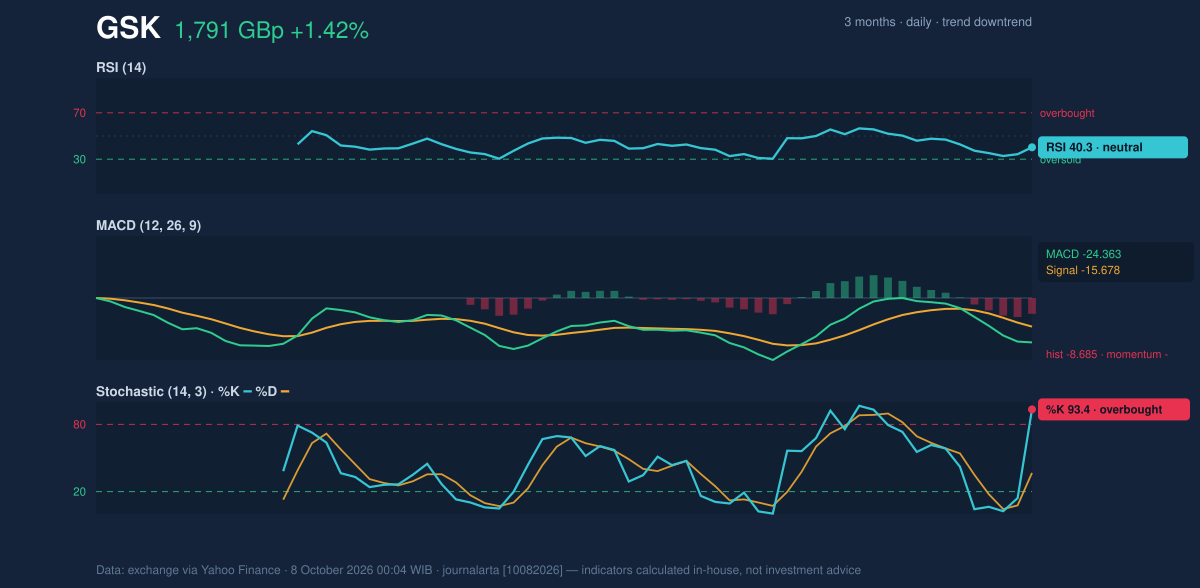
Volatility & Volume
GSK’s Bollinger Bands are neither especially tight nor unusually wide: the band width is 10.8%, classified as normal. The %B reading of 26% places the share closer to the lower band than the upper one, consistent with its position below the 20-day average. The bands run from 1,739.34 GBp to 1,937.26 GBp, with the middle line at 1,838.30 GBp. Bollinger Bands show how far price has moved from its recent average; proximity to the lower band reflects weakness, but is not a stand-alone reversal signal. Volatility is high: the 14-day ATR is 167.52 GBp, or 9.4% of the share price. ATR estimates the typical size of price moves, not their direction. That scale means movements around support or resistance could be substantial. Participation in the latest rise was notably weak. Volume was 101,885 shares, against a 20-day average of 6,176,648, while OBV was falling. OBV tracks whether volume tends to accompany rising or falling prices. Together, these readings weaken the case that the one-day rebound reflects broad buying interest.Key Levels & Scenarios
The first test is support at 1,759.00 GBp. A failure to hold it would add pressure to an already negative MACD and down-sloping average. On the upside, 1,838.30 GBp, the SMA20, is the initial hurdle; the share would then need to contend with resistance at 1,911.00 GBp. A move through those levels would improve the chart’s tone, but the weak volume means confirmation matters.Technical Verdict: HOLD (wait & see)
The indicators support a wait-and-see reading: the price remains below both moving averages, MACD momentum is negative, and falling OBV alongside very low volume does not confirm the daily rebound. The neutral RSI and proximity to support argue against treating the chart as an unambiguous continuation signal.- Ideal entry range: 1,759.00–1,838.30 GBp, bounded by 20-day support and the SMA20.
- Exit target: 1,911.00 GBp, the 20-day resistance level.
- Stop-loss protection: below 1,739.34 GBp, the lower Bollinger Band.
| Indicator | Reading |
|---|---|
| Last price | 1,790.50 GBp |
| Five-day change | -2.27% |
| SMA20 / SMA50 | 1,838.30 / 1,868.53 GBp |
| RSI(14) | 40.3, neutral |
| Stochastic %K / %D | 93.4 / 36.7; %K overbought |
| MACD / signal / histogram | -24.363 / -15.678 / -8.685 |
| 20-day support / resistance | 1,759.00 / 1,911.00 GBp |
| ATR(14) | 167.52 GBp; 9.4% of price |
Summary Data GSK
| Last price | 1,790.50 GBp |
| Change 1 day / 5 days / 1 month | 1.42% / -2.27% / -0.72% |
| Trend / MA-cross | downtrend / none |
| SMA20 / SMA50 | 1,838.30 / 1,868.53 |
| RSI (14) / Stochastic %K | 40.3 / 93.4 |
| Bollinger %B / ATR | 26% / 167.52 |
| Support / Resistance 20 days | 1,759.00 / 1,911.00 |
| Data as of | 8 October 2026 00:04 WIB |
Disclaimer: This technical analysis is generated automatically from exchange data (via Yahoo Finance) and indicators calculated by JournalArta, for information and education only. The verdict and the entry, target and stop-loss levels are not investment advice or a solicitation to buy or sell any security. Investment decisions and their risks rest solely with the reader.
Track GSK share price daily: live levels, support/resistance and our full GSK analysis history.