Rolls-Royce Stock Analysis: Drops 2.35%, Testing Support Level
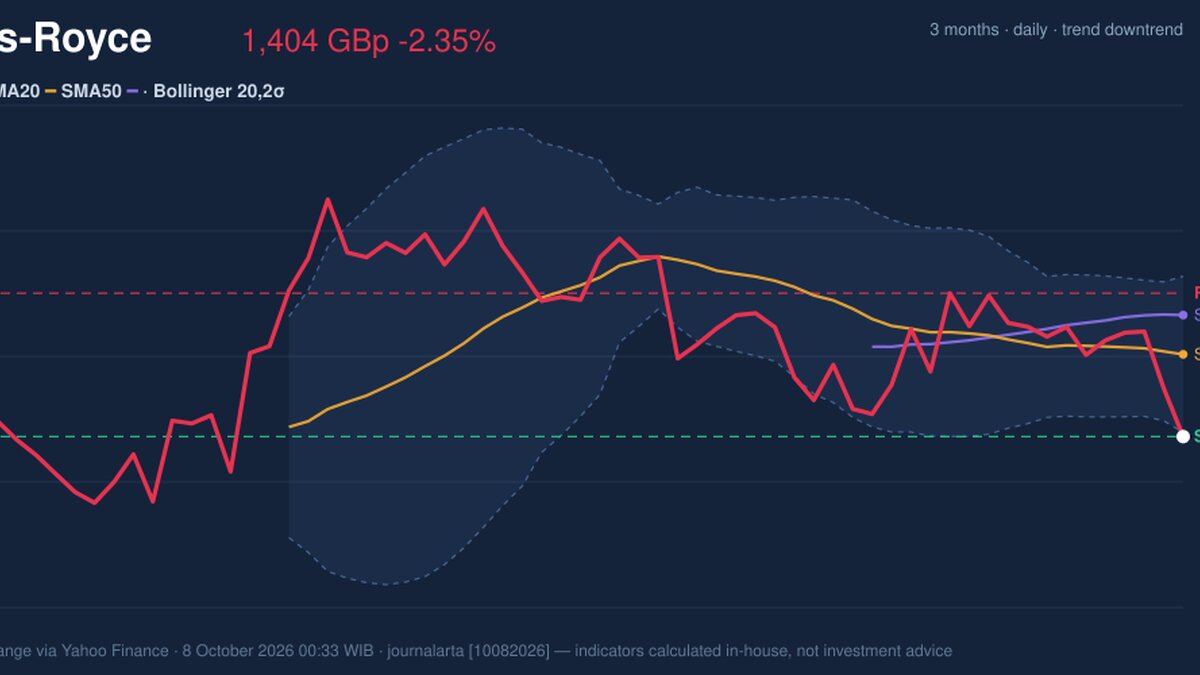
On October 7, 2026: price 1,404.40 GBp, trend downtrend, RSI 37.0, support 1,404.40, resistance 1,504.80. technical analysis of rolls-royce stock.
Trend & Price Action
The technical picture remains under pressure. Rolls-Royce is trading below its SMA20 of 1,462.05 GBp and SMA50 of 1,489.56 GBp; a simple moving average tracks the average price over a set period, helping show the prevailing direction. The SMA20 is declining by 0.40% over five days, while no new moving-average crossover has formed. That combination points to an established downtrend rather than a confirmed reversal. At 1,404.40 GBp, the share is at the stated 20-day support and at 0% of its 20-day range. Its 20-day resistance is 1,504.80 GBp. The three-month high is 1,586.00 GBp; the supplied low is 0.00 GBp, which is not a usable reference for a practical trading level. The close at range support is a test of whether sellers can extend the decline or buyers can defend the floor. A close below that support would weaken the price structure further; a recovery would first need to contend with the moving averages overhead.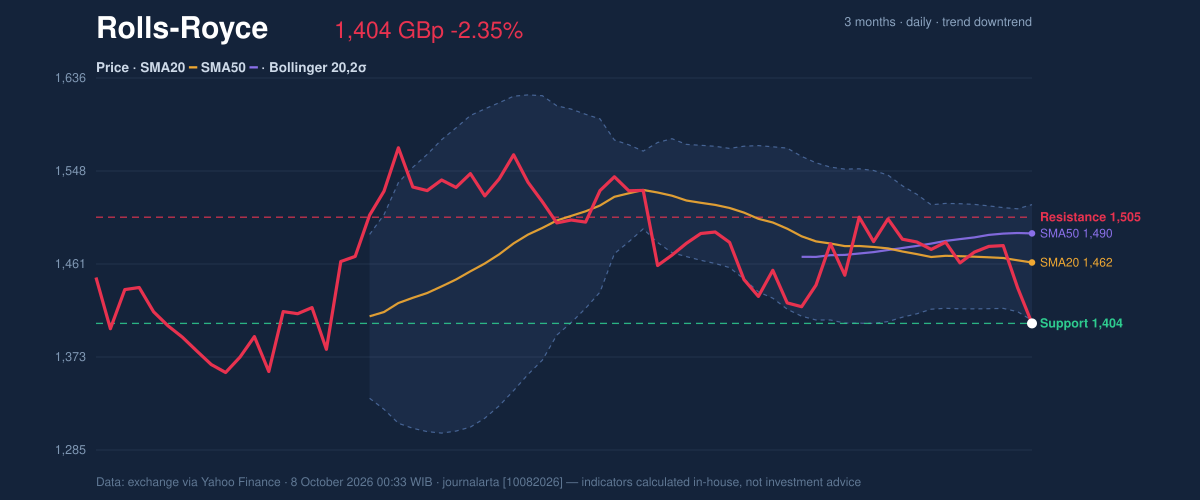
Oscillators & Momentum
Momentum indicators are mixed, but the stronger signals still lean negative. The RSI is 37.0, a neutral reading that is relatively weak without, on its own, confirming an oversold condition. The Stochastic is overbought, with %K at 92.8 and %D at 52.3. This oscillator compares a closing price with its recent trading range; the high %K suggests a short-term bounce may have run ahead of the broader trend, rather than demonstrating that the downtrend has turned. The MACD is negative at -9.090, below its -4.171 signal line, with a -4.919 histogram. MACD compares shorter- and longer-term price momentum. Its position below the signal line indicates that downward momentum remains in control, even as the Stochastic warns that near-term trading may be stretched. RSI is weak-neutral, Stochastic is overbought, and MACD remains negative: the indicators do not yet confirm a durable reversal.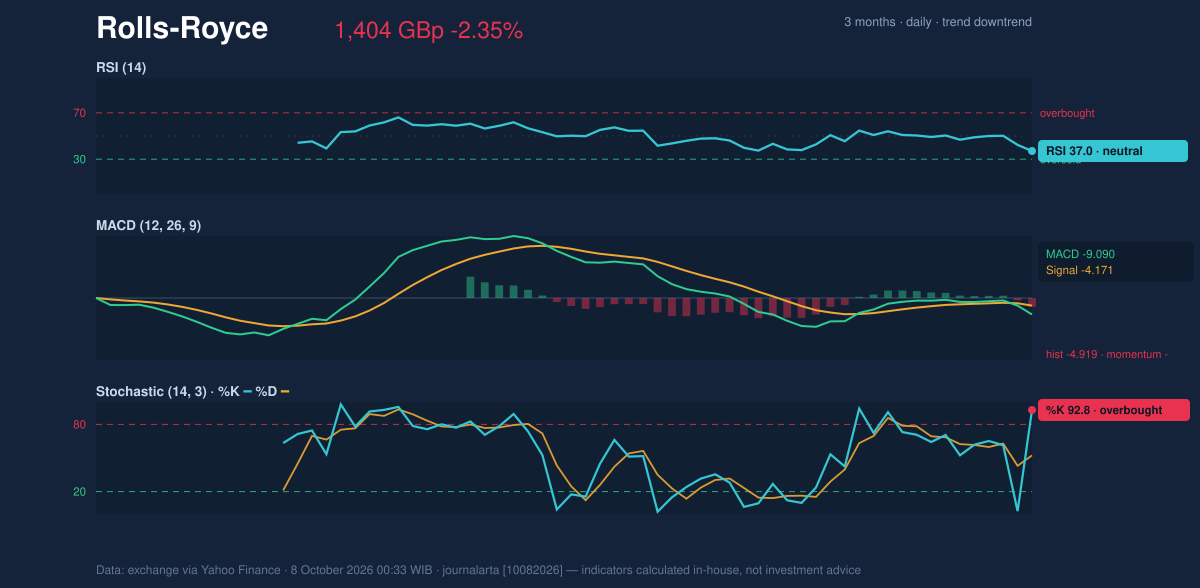
Volatility & Volume
The Bollinger bands are 7.5% wide, a narrowing configuration often called a squeeze because price volatility has contracted. Rolls-Royce is now outside the lower band: the lower boundary is 1,407.32 GBp, and %B is -3%. %B shows where price sits relative to the bands; a negative reading means it is below the lower boundary. That is a sign of downside pressure, not a standalone forecast of further losses. The ATR is 137.55 GBp, equal to 9.8% of the share price. ATR estimates the typical size of price movements, so this reading signals substantial volatility and makes precise level-based scenarios less certain. Participation offers little confirmation of the latest move: volume was 1,473,604 shares, just 0.1 times the 20-day average of 16,004,284, while OBV is falling. OBV tracks whether volume is flowing more heavily on rising or falling sessions; its decline supports the cautious reading, though the thin session volume limits how much weight to place on the day’s move alone.Key Levels & Scenarios
The immediate reference is 1,404.40 GBp, the 20-day support and closing level. If price falls below it, the supplied data provide no lower support level to define the next test. A recovery would need to overcome the 1,462.05 GBp SMA20, followed by 1,489.56 GBp at the SMA50; the stated 20-day resistance is 1,504.80 GBp. These are conditional markers, not forecasts: reclaiming them would improve the structure, while failure to hold support would keep the downside signal intact.Technical Verdict: HOLD (wait & see)
The indicators support a neutral verdict rather than a directional one. Price is below both moving averages and at 20-day support; MACD and OBV point lower. Against that, the session’s volume was unusually thin, while the Stochastic is overbought and the Bollinger squeeze leaves the direction of any volatility expansion unconfirmed. The verdict is invalidated if the price falls below 1,404.40 GBp. - Ideal entry range: 1,404.40–1,462.05 GBp, bounded by 20-day support and the SMA20. - Exit target: 1,504.80 GBp, the stated 20-day resistance. - Stop-loss protection: Below 1,404.40 GBp, the supplied support and invalidation level. For non-traders, the signal is to wait for clearer evidence that the share can hold support or recover its moving averages.Data source: exchange data via Yahoo Finance, as of 8 October 2026 at 00:33 WIB. Technical analysis is not an investment recommendation.
Why Rolls-Royce is in focus today
- Closed at a 20-day low (1,404.40)
- Breaking out of a Bollinger squeeze (band width 7.5%)
- Downtrend extending (5-day change -3.91%)
- Not covered by JournalArta in the last 14 days
Selected automatically from 16 LSE (UK) stocks by a technical-signal score with daily weighted randomisation — not a recommendation.
Summary Data Rolls-Royce
| Last price | 1,404.40 GBp |
| Change 1 day / 5 days / 1 month | -2.35% / -3.91% / -2.86% |
| Trend / MA-cross | downtrend / none |
| SMA20 / SMA50 | 1,462.05 / 1,489.56 |
| RSI (14) / Stochastic %K | 37.0 / 92.8 |
| Bollinger %B / ATR | -3% / 137.55 |
| Support / Resistance 20 days | 1,404.40 / 1,504.80 |
| Data as of | 8 October 2026 00:33 WIB |
Disclaimer: This technical analysis is generated automatically from exchange data (via Yahoo Finance) and indicators calculated by JournalArta, for information and education only. The verdict and the entry, target and stop-loss levels are not investment advice or a solicitation to buy or sell any security. Investment decisions and their risks rest solely with the reader.
Track Rolls-Royce share price daily: live levels, support/resistance and our full Rolls-Royce analysis history.