AMZN Stock Gains 3.29% on Friday, Testing Key Resistance
On October 9, 2026: price 262.43 USD, trend sideways, RSI 59.0, support 245.96, resistance 262.43. technical analysis of amzn stock. AMZN Stock Gains — full…
Why AMZN is in focus today
- One-day move of 3.29%, about 1.5× its average daily range (ATR)
- Closed at a 20-day high (262.43)
- Breaking out of a Bollinger squeeze (band width 7.1%)
- Not covered by JournalArta in the last 14 days
Selected automatically from 32 NASDAQ (US) stocks by a technical-signal score with daily weighted randomisation — not a recommendation.
Trend & Price Action
Amazon’s shares are above the 20-day simple moving average (SMA) of $252.02, while the 50-day SMA is $259.10. The 20-day average is edging upward, but there has been no recent crossover between the two averages. This points to improving short-term price action within a broader sideways trend, rather than a confirmed shift into a sustained uptrend. The close at $262.43 put the stock at the top of its 20-trading-day range and above the Bollinger upper band at $261.02. A close beyond that band can signal an unusually strong move, but it is not proof the rise will continue: prices can also return inside the bands after a brief burst. The bands’ recent squeeze indicates that volatility had been contracting, a condition that can precede a larger move without determining its direction. As shown in the chart, the price has moved above the upper band and sits at the near-term resistance level. The 20-day support is $245.96; a retreat toward it would test whether buyers are willing to defend the recent advance.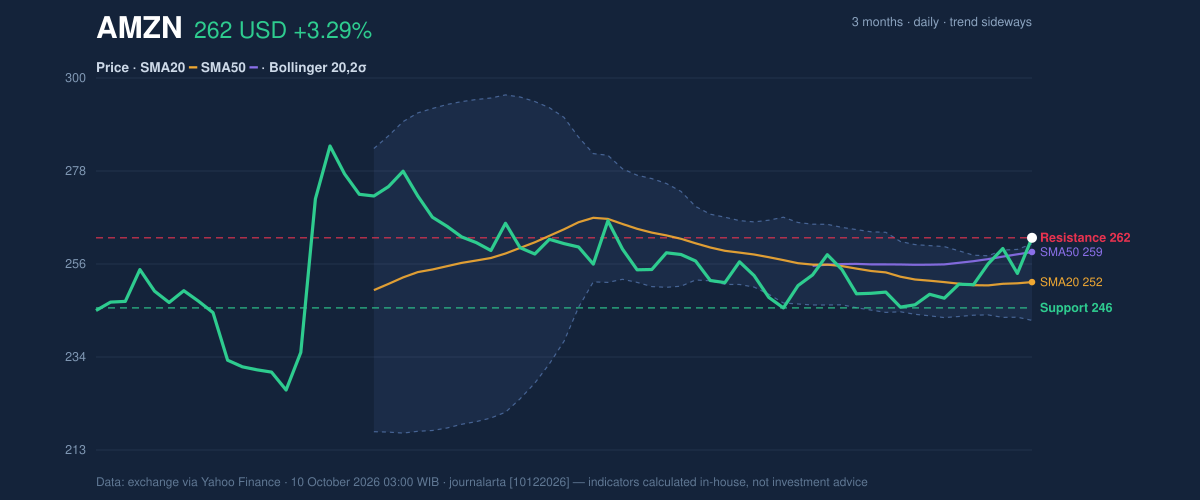
Oscillators & Momentum
Momentum indicators are positive but not uniformly supportive. The RSI is 59.0, a neutral reading that suggests the stock has gained ground without reaching the conventionally overbought zone. The Stochastic is overbought, with %K at 98.0 and %D at 85.7, indicating that the latest rise has been rapid relative to recent trading. This can leave shares vulnerable to a pause or pullback, even while the trend remains firm. The MACD momentum signal is positive: its histogram is 1.438, with MACD at 0.368 against a signal line of -1.070. MACD compares short- and longer-term price momentum; a positive histogram means upward momentum is strengthening relative to its signal line. Together, the readings show a short-term push that has not yet been confirmed by every indicator.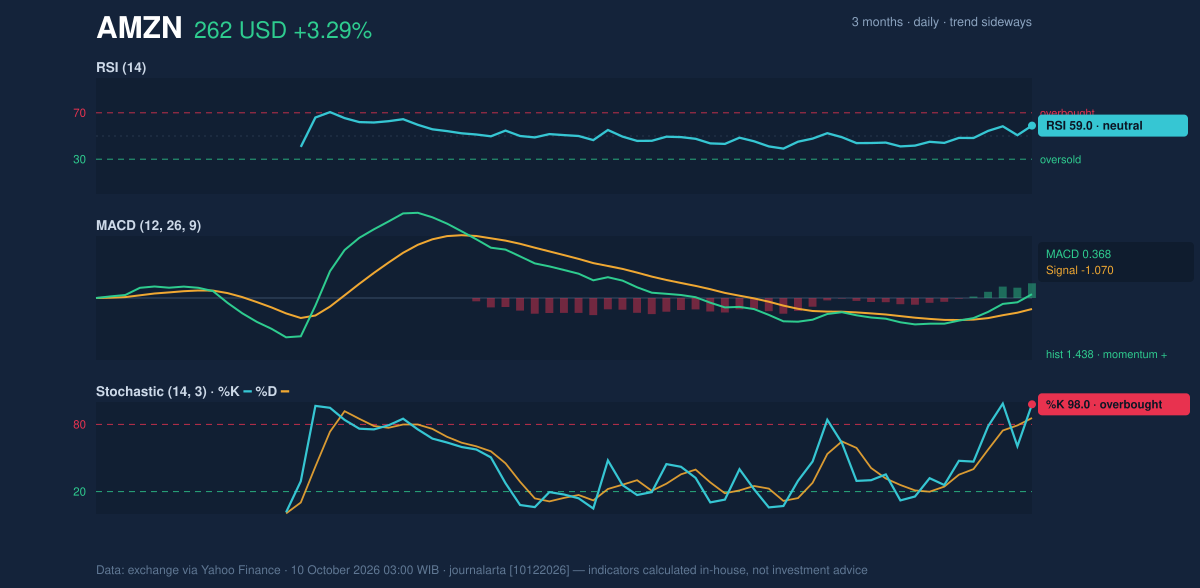
Volatility, Volume & Key Levels
Trading volume was 34,710,500 shares, or 0.9 times the 20-day average. That is below normal participation, tempering the significance of a move to a new 20-day closing high. On the other hand, On-Balance Volume (OBV), which tracks whether volume tends to accompany rising or falling prices, is rising—evidence that buying pressure has been building. The average true range (ATR), a measure of typical daily price movement, is $5.63, or 2.1% of the share price, pointing to moderate volatility. The stock is also above the upper Bollinger band, while the bands remain narrow; that mix can produce sharp movement in either direction. The immediate test is whether Amazon can hold above the upper-band area around $261.02 and sustain a close beyond the 20-day resistance at $262.43. If it fails to hold that zone, the 20-day SMA at $252.02 is a nearer reference point, with support at $245.96. The three-month range extends from $226.16 to $287.20, placing the current price below the period high.Technical Verdict: HOLD (wait & see)
The indicators show a credible upside attempt, but not enough confirmation to treat it as a settled breakout. The MACD histogram is positive, OBV is rising, and the close is above both moving averages. Against that, the Stochastic is overbought, volume was below its 20-day average, and the broader trend remains sideways. The verdict is invalidated if the price falls below $245.96.- Ideal entry range: $252.02–$261.02, around the 20-day SMA and upper Bollinger band, subject to price stabilizing in that area.
- Exit target: $262.43, the current 20-day resistance; a sustained break above it would change the technical setup.
- Stop-loss protection: Below $245.96, the 20-day support level.
Summary Data AMZN
| Last price | 262.43 USD |
| Change 1 day / 5 days / 1 month | 3.29% / 4.34% / 2.20% |
| Trend / MA-cross | sideways / none |
| SMA20 / SMA50 | 252.02 / 259.10 |
| RSI (14) / Stochastic %K | 59.0 / 98.0 |
| Bollinger %B / ATR | 108% / 5.63 |
| Support / Resistance 20 days | 245.96 / 262.43 |
| Data as of | 10 October 2026 03:00 WIB |
Disclaimer: This technical analysis is generated automatically from exchange data (via Yahoo Finance) and indicators calculated by JournalArta, for information and education only. The verdict and the entry, target and stop-loss levels are not investment advice or a solicitation to buy or sell any security. Investment decisions and their risks rest solely with the reader.
Track AMZN stock price daily: live levels, support/resistance and our full AMZN analysis history.