China Mobile Stock Analysis: Gains 0.88%, Testing Key Resistance
On October 9, 2026: price 80.10 HKD, trend sideways, RSI 59.3, support 78.45, resistance 80.10. technical analysis of china mobile stock.
Why China Mobile is in focus today
- Closed at a 20-day high (80.10)
- Breaking out of a Bollinger squeeze (band width 1.7%)
- Not covered by JournalArta in the last 14 days
Selected automatically from 16 HKEX (Hong Kong) stocks by a technical-signal score with daily weighted randomisation — not a recommendation.
Trend & Price Action
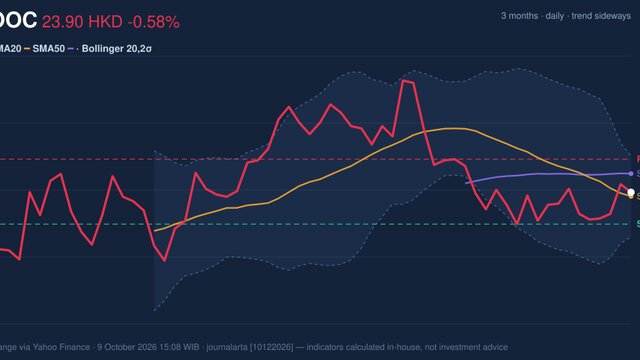
China Mobile’s share price is above its 20-day simple moving average of HK$79.11, but slightly below its 50-day average of HK$80.28. A simple moving average smooths recent prices to show direction; the gap between the two averages means the short-term improvement has not yet established a broader upward trend. No new moving-average crossover has formed. The stock has risen 1.59% over both five days and one month, while its 20-day average has a modest upward slope. That fits a market still classified as sideways, rather than one with a decisive trend. The close at HK$80.10 is also the 20-day resistance level recorded in the data, leaving the shares at the top of their recent range. As shown in the chart, the price has moved above the upper Bollinger band at HK$79.77. Bollinger bands measure how far a price has moved from its recent average; the band width of 1.7% indicates a squeeze, or unusually compressed volatility. A move out of a squeeze can precede a larger price swing, but does not determine its direction. The close above the band is a sign of immediate strength, not proof that the move will hold.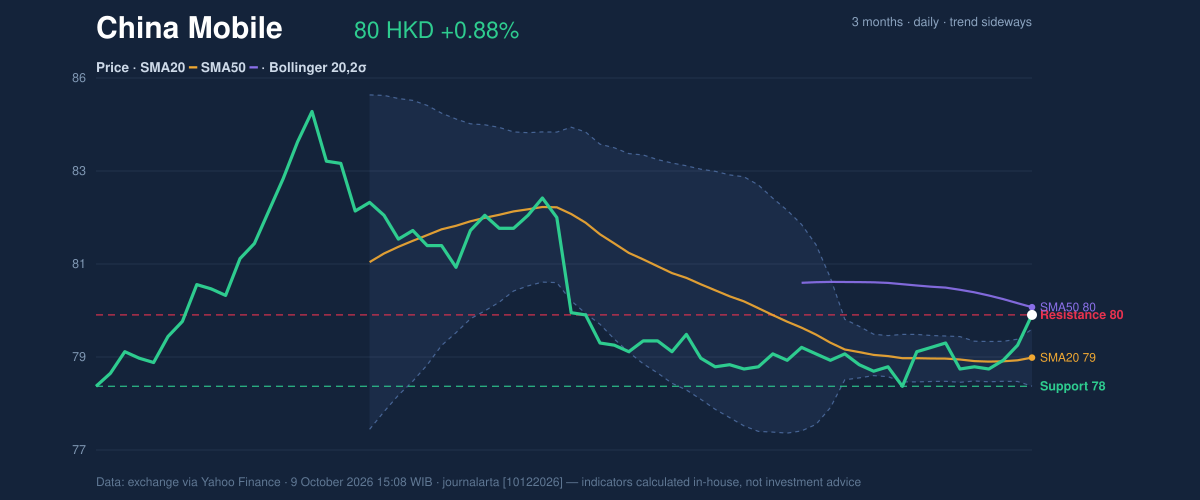
Oscillators & Momentum
Momentum indicators are giving mixed signals. The RSI is 59.3, in neutral territory, which suggests the share price has strengthened without yet reaching the level commonly associated with an overbought market. By contrast, the Stochastic reading is overbought, with %K at 95.1 and %D at 71.3. Stochastic compares a closing price with its recent trading range; a high reading can indicate strong buying pressure, but also leaves less room for a near-term rise before a pullback becomes more likely. The MACD momentum reading is positive: its histogram is 0.158, with MACD at -0.139 above its signal line at -0.297. MACD compares shorter- and longer-term price averages to assess whether momentum is improving or weakening. Here, the positive histogram supports the recent advance, although the negative MACD value cautions against treating that improvement as a fully established upward trend. As shown in the chart, the indicators therefore agree that near-term momentum has improved, but differ on how extended the move has become.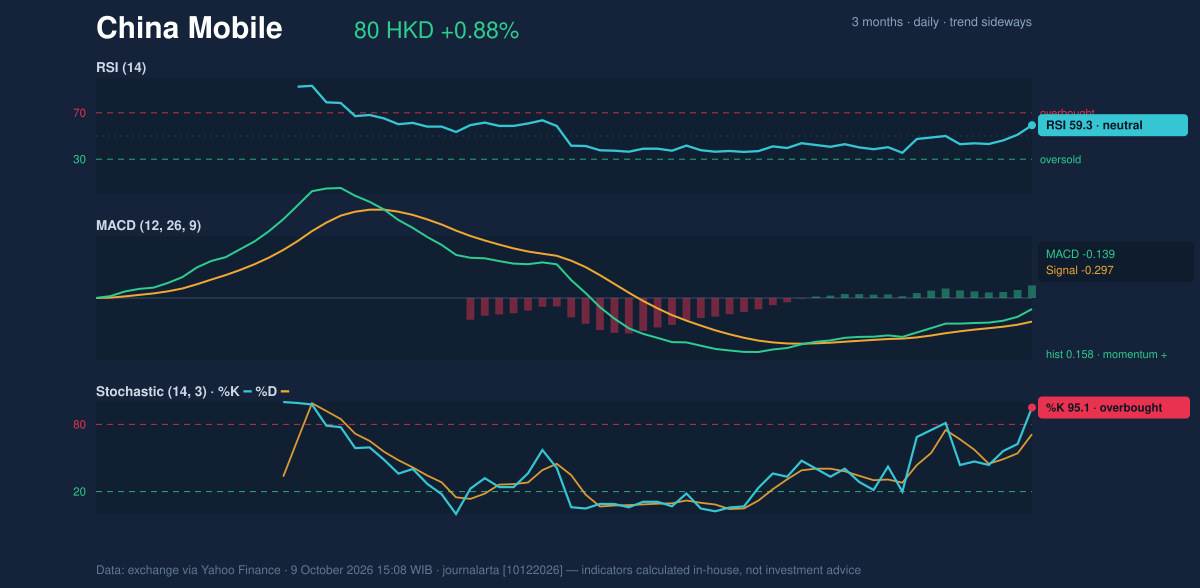
Volatility, Volume & Levels
Turnover reached 13.1 million shares, about 1.4 times the 20-day average, and the on-balance volume measure is rising. OBV tracks whether volume is stronger on rising or falling sessions; its increase alongside above-average turnover suggests the price move has attracted participation rather than occurring on thin trading. Volatility remains restrained. The average true range is HK$0.69, or 0.9% of the share price, indicating that recent daily swings have been relatively small. If the price holds above the upper band and the HK$80.10 resistance, a sustained break would provide stronger evidence that the squeeze is resolving upwards. If it fails there, the HK$79.11 20-day average is a nearer reference point; below that, HK$78.45 support becomes important. The three-month range runs from HK$78.15 to HK$84.95, putting the recent advance well below the period high.Technical Verdict: HOLD (wait & see)
The indicators support a cautious, conditional reading rather than a confirmed trend change. The price is above its 20-day average and the MACD histogram is positive, while higher turnover and rising OBV add evidence of participation. But the price remains below its 50-day average, and the overbought Stochastic reading raises the chance of a pause near resistance. - Ideal entry range: HK$79.11–HK$80.28, anchored to the 20-day and 50-day averages. - Exit target: HK$84.95, the three-month high. - Stop-loss protection: HK$78.45, the 20-trading-day support. - Invalidation: This verdict is invalidated if the price falls below HK$78.45. For non-traders, HOLD means the signals are improving, but the move has not yet cleared enough hurdles to establish a stronger trend.Summary Data China Mobile
| Last price | 80.10 HKD |
| Change 1 day / 5 days / 1 month | 0.88% / 1.59% / 1.59% |
| Trend / MA-cross | sideways / none |
| SMA20 / SMA50 | 79.11 / 80.28 |
| RSI (14) / Stochastic %K | 59.3 / 95.1 |
| Bollinger %B / ATR | 125% / 0.69 |
| Support / Resistance 20 days | 78.45 / 80.10 |
| Data as of | 9 October 2026 15:08 WIB |
Disclaimer: This technical analysis is generated automatically from exchange data (via Yahoo Finance) and indicators calculated by JournalArta, for information and education only. The verdict and the entry, target and stop-loss levels are not investment advice or a solicitation to buy or sell any security. Investment decisions and their risks rest solely with the reader.
Track China Mobile share price daily: live levels, support/resistance and our full China Mobile analysis history.