IBM Death Cross Pressure: Stock Gains 0.23% (October 9, 2026)
On October 9, 2026: price 227.13 USD, trend downtrend, RSI 47.0, support 219.93, resistance 249.09. technical analysis of ibm stock. IBM Death Cross Pressure —…
Why IBM is in focus today
- Fresh death cross: SMA20 crossed below SMA50
- MACD histogram has just turned positive
- Not covered by JournalArta in the last 14 days
Selected automatically from 30 NYSE (US) stocks by a technical-signal score with daily weighted randomisation — not a recommendation.
Trend & Price Action
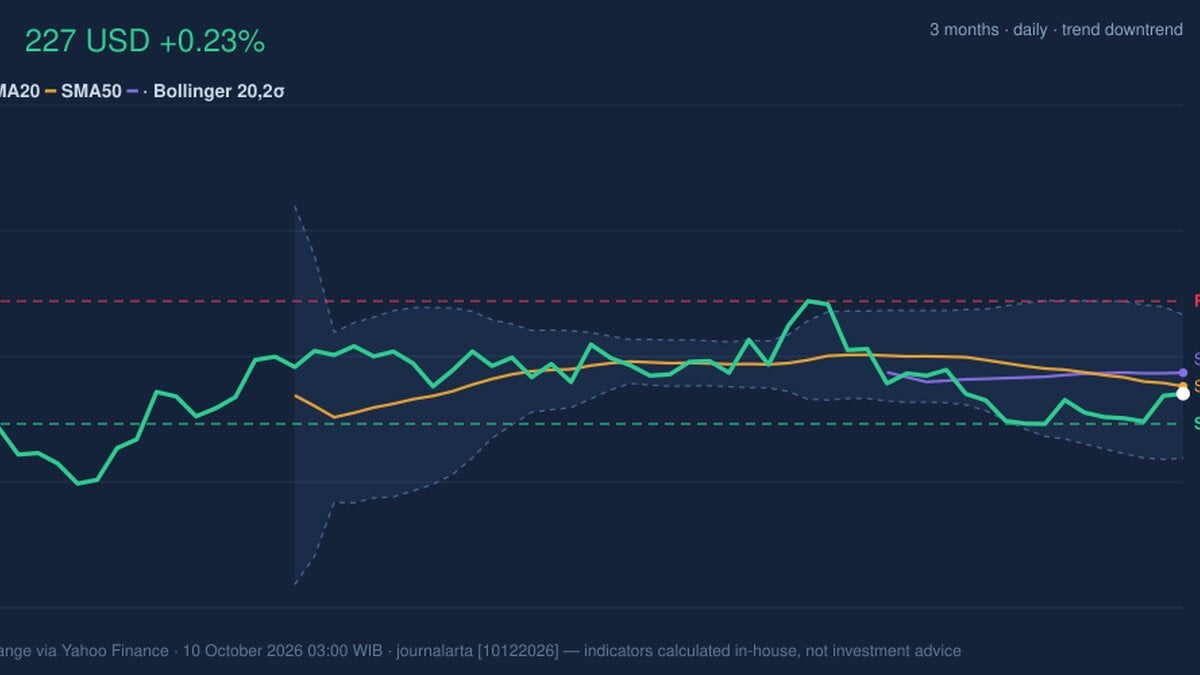
IBM is in a downtrend, with its 20-day simple moving average (SMA) — the average closing price over the past 20 trading sessions — falling 1.45% in five days. The stock is below its SMA20 at US$228.84 and its SMA50 at US$232.08. The 20-day average has crossed beneath the 50-day average, a death cross that signals deteriorating near-term price structure. It is not, by itself, proof that losses will continue, but it does mean the recent weakness has carried enough weight to pull the shorter average below the longer one. The price is near the lower quarter of its 20-trading-day range, bounded by support at US$219.93 and resistance at US$249.09. Over the past three months, IBM has traded between US$199.19 and US$298.77, placing the current price well below the period high. Bollinger Bands, which measure how far a price has moved from its recent average, span US$211.80 to US$245.88, with the middle band at US$228.84. At 45% of the way between the lower and upper bands, IBM is below its middle line but not pressing against the lower edge.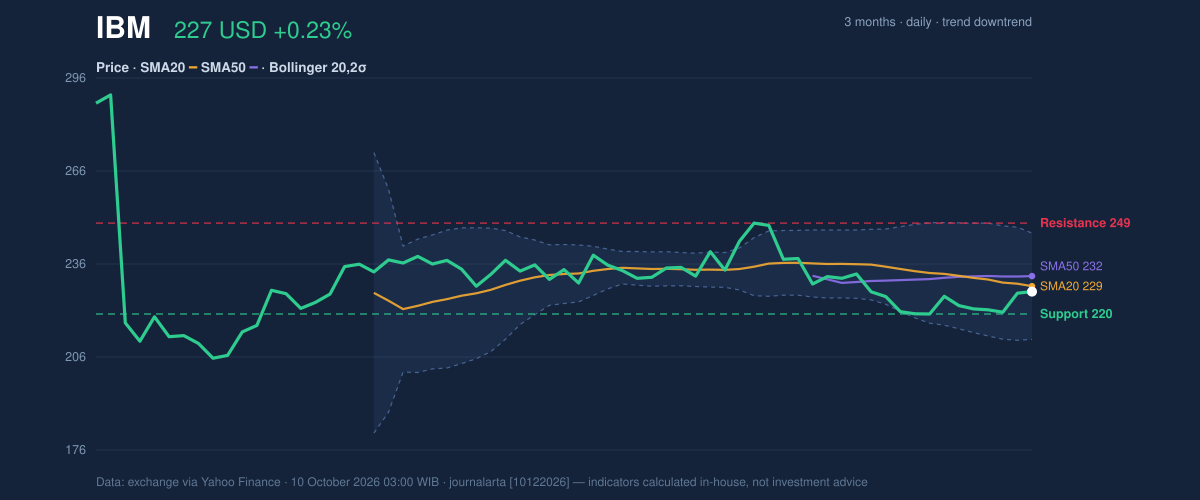
Oscillators & Momentum
Momentum indicators offer a less bearish reading than the moving averages. The RSI is neutral at 47.0; the Relative Strength Index gauges the pace of recent gains and losses, and a neutral reading suggests neither buyers nor sellers currently dominate. The Stochastic is also neutral, with %K at 46.5 and %D at 33.4. Its faster line is above the slower one, consistent with an improvement in short-term momentum, though not enough to establish a strong upward move. The MACD remains below zero at -3.184, meaning the broader momentum measure is still in negative territory. But it is above its signal line of -3.334, and the histogram has turned positive at 0.150. The histogram tracks the gap between MACD and its signal line, so this shift indicates that downward momentum has eased and could be starting to reverse. It is a tentative change, not confirmation that the downtrend has ended.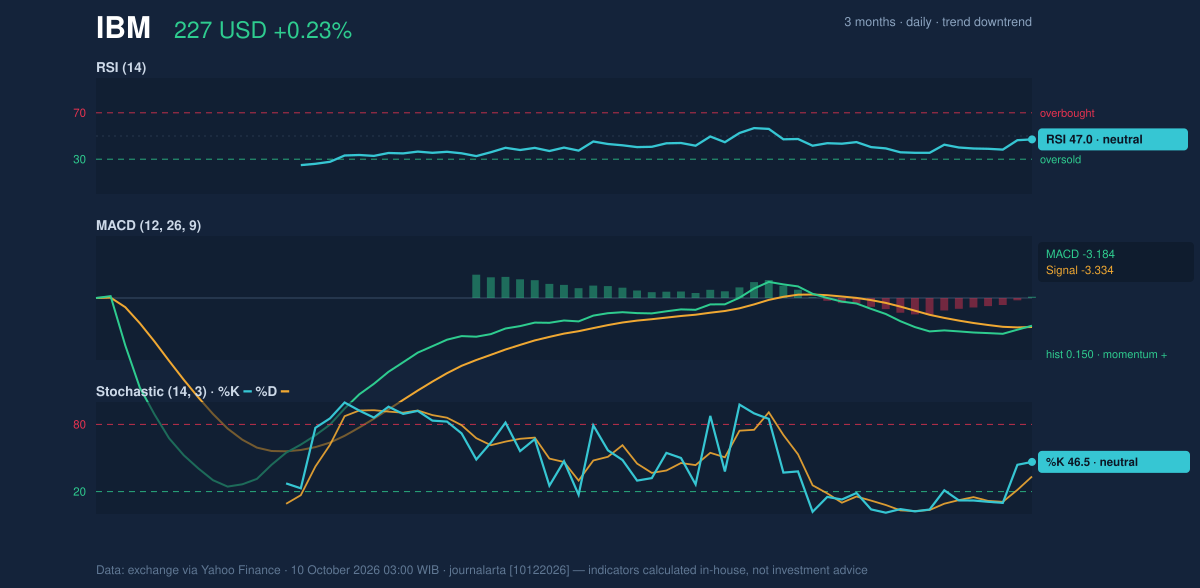
Volatility & Volume
Bollinger Band width is 14.9%, described as normal rather than unusually tight or wide. That gives no strong signal of an imminent volatility breakout. The 14-day Average True Range (ATR), a measure of typical daily price movement, is US$5.64, or 2.5% of the share price: volatility is moderate, so moves around support and resistance may be meaningful without being exceptional. Trading participation remains a concern for any attempted rebound. Latest volume was 3,351,300 shares, about 0.6 times the 20-day average of 5,972,670, while On-Balance Volume (OBV), which tracks whether trading volume accompanies rising or falling prices, is declining. The light volume means the day’s gain has not yet drawn broad participation; falling OBV adds to the caution. A stronger recovery would be more convincing if buyers returned in greater numbers.Key Levels & Scenarios
The first test is whether IBM can regain its US$228.84 SMA20 and Bollinger midpoint, followed by the US$232.08 SMA50. Holding above those averages would help repair the price structure. If the shares fail to hold US$219.93, the near-term support level, the next reference from the supplied data is the lower Bollinger Band at US$211.80. A break above the averages, by contrast, would bring the 20-day resistance at US$249.09 into focus.Technical Verdict: HOLD (wait & see)
The indicators are divided: the death cross and falling OBV point to persistent weakness, while the positive MACD histogram and neutral oscillators suggest selling pressure may be easing. Thin volume makes the momentum improvement less persuasive. The verdict is invalidated if the price falls below US$219.93. - Ideal entry range: US$219.93–US$228.84, bounded by 20-day support and the SMA20. - Exit target: US$249.09, the 20-day resistance level. - Stop-loss protection: US$211.80, the lower Bollinger Band. In plain English, IBM’s chart shows early signs of stabilisation, but not yet enough confirmation to resolve the broader downtrend.Summary Data IBM
| Last price | 227.13 USD |
| Change 1 day / 5 days / 1 month | 0.23% / 2.02% / -6.64% |
| Trend / MA-cross | downtrend / death |
| SMA20 / SMA50 | 228.84 / 232.08 |
| RSI (14) / Stochastic %K | 47.0 / 46.5 |
| Bollinger %B / ATR | 45% / 5.64 |
| Support / Resistance 20 days | 219.93 / 249.09 |
| Data as of | 10 October 2026 03:00 WIB |
Disclaimer: This technical analysis is generated automatically from exchange data (via Yahoo Finance) and indicators calculated by JournalArta, for information and education only. The verdict and the entry, target and stop-loss levels are not investment advice or a solicitation to buy or sell any security. Investment decisions and their risks rest solely with the reader.
Track IBM stock price daily: live levels, support/resistance and our full IBM analysis history.