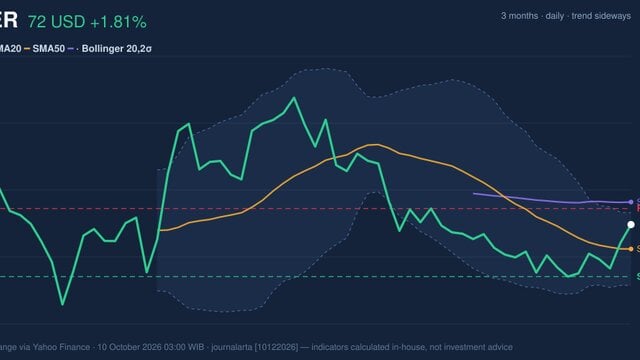
PYPL Stock Gains 0.93% on Friday, Testing Key Resistance
On October 9, 2026: price 55.53 USD, trend sideways, RSI 56.4, support 52.41, resistance 55.53. technical analysis of pypl stock. PYPL Stock Gains — full…
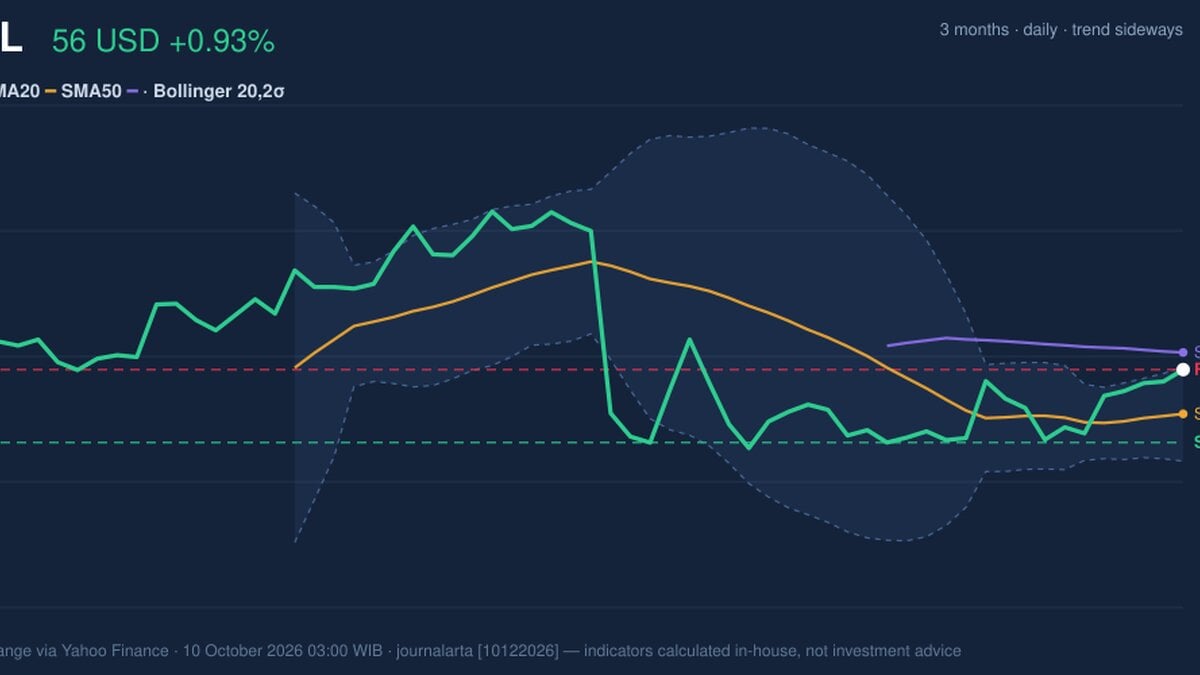
Why PYPL is in focus today
- Closed at a 20-day high (55.53)
- Not covered by JournalArta in the last 14 days
Selected automatically from 32 NASDAQ (US) stocks by a technical-signal score with daily weighted randomisation — not a recommendation.
Trend & Price Action
PayPal’s $55.53 close is 100% of the 20-trading-day range, whose resistance is also $55.53 and whose support is $52.41. That makes the latest close a test of the range ceiling, not a confirmed break above it. A sustained move beyond resistance would signal that buyers are overcoming recent supply; a retreat into the range would suggest the ceiling still matters. The shares stand above the SMA20 at $53.63, which has risen 0.67% over five days, but remain below the SMA50 at $56.27. The shorter average’s positive slope and the share price’s position above it point to improving near-term structure. Yet the absence of a recent moving-average crossover means there is no signal that the short-term trend has decisively overtaken the longer one. The three-month high of $62.73 and low of $45.76 provide wider context: the latest advance has not erased the distance from the period’s peak. As shown in the chart, price is pressing the upper edge of its recent range while approaching the 50-day average.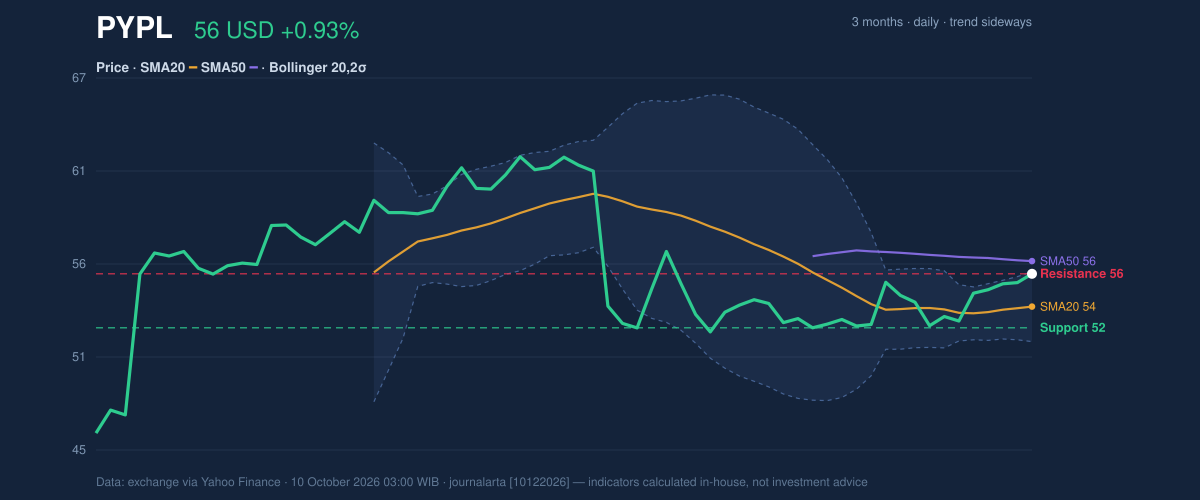
Oscillators & Momentum
Momentum readings are improving, but they are not in full agreement. The RSI is 56.4, a neutral reading: it suggests neither unusually strong buying pressure nor an oversold condition that would, by itself, point to a rebound. The Stochastic readings—%K at 96.1 and %D at 88.7—are overbought, indicating that the latest push has been fast relative to the recent trading range. Overbought does not mean an immediate reversal is certain; it does mean further gains may be more vulnerable to a pause or pullback. The MACD histogram is positive at 0.394, while the MACD line at -0.119 remains below zero and above its signal line at -0.513. The positive histogram shows improving momentum relative to the signal line, but the negative MACD reading cautions that the recovery has not yet fully shifted the indicator’s broader position. Together, the indicators describe a short-term upswing with a stretched stochastic reading—not a clean, across-the-board confirmation. The chart helps distinguish that improving MACD momentum from the Stochastic’s more immediate warning.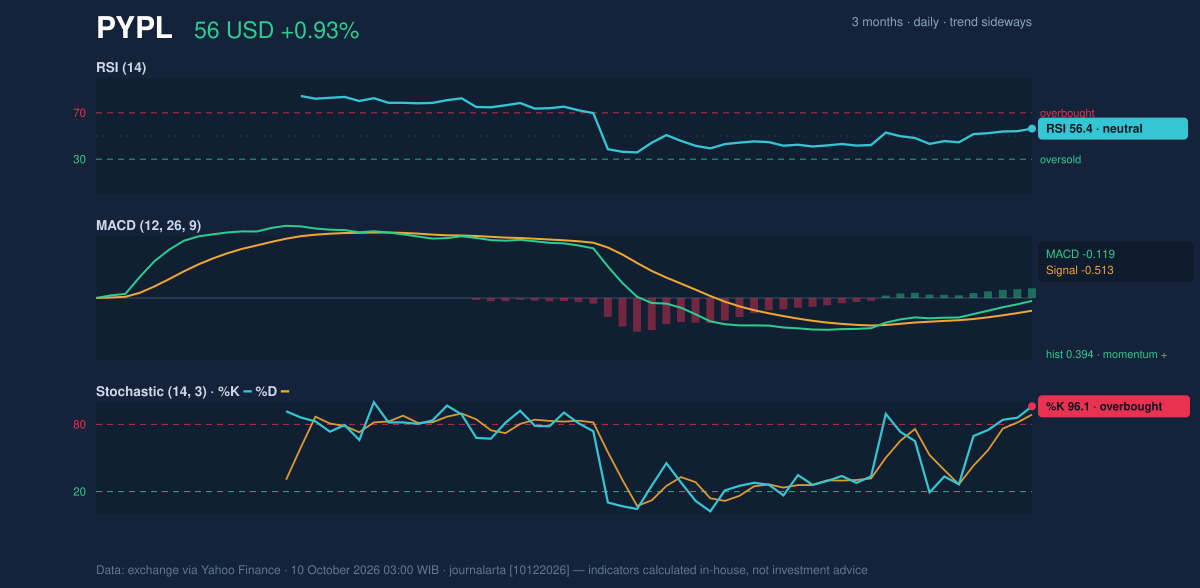
Volatility & Volume
The Bollinger Band reading places PayPal near the top of its recent volatility envelope. %B is 97%, with the upper band at $55.65, the midpoint at $53.63 and the lower band at $51.61. In plain terms, the close is close to the upper band, consistent with strong recent price action but also leaving little room before the band itself is tested. The band width is 7.5% and is narrowing, a squeeze that can precede a larger move but does not determine its direction. The ATR is $1.50, or 2.7% of the share price, indicating moderate daily price variability. Volume of 11,858,000 was about 1.0 times the 20-day average of 11,932,065, while OBV is rising. The near-normal volume means the advance did not arrive with a pronounced surge in trading participation; rising OBV, however, suggests buying pressure has been building across the measured period.Key Levels & Scenarios
The immediate test is $55.53 resistance, followed by the $56.27 SMA50. A move through both would strengthen the case that the short-term recovery is challenging the broader trend. Failure to hold the range high could bring attention back to the rising $53.63 SMA20; below that, the $52.41 support is the defined 20-day floor. The narrowing Bollinger Bands make a larger move possible, but the indicators do not specify its direction.Technical Verdict: HOLD (wait & see)
The technical verdict is HOLD (wait & see): the rising SMA20 and positive MACD histogram support the recovery, while the price remains below the SMA50 and the Stochastic is overbought. The verdict is invalidated if the price falls below $52.41, the 20-day support.- Ideal entry range: $53.63–$55.53, anchored by the SMA20 and current range resistance.
- Exit target: $56.27, the SMA50.
- Stop-loss protection: $52.41, the 20-day support.
| Metric | Reading |
|---|---|
| Last price | $55.53 |
| SMA20 / SMA50 | $53.63 / $56.27 |
| RSI(14) | 56.4 (neutral) |
| Stochastic %K / %D | 96.1 / 88.7 (overbought) |
| MACD histogram | 0.394 (positive) |
| Support / resistance (20 trading days) | $52.41 / $55.53 |
Summary Data PYPL
| Last price | 55.53 USD |
| Change 1 day / 5 days / 1 month | 0.93% / 5.17% / 3.37% |
| Trend / MA-cross | sideways / none |
| SMA20 / SMA50 | 53.63 / 56.27 |
| RSI (14) / Stochastic %K | 56.4 / 96.1 |
| Bollinger %B / ATR | 97% / 1.50 |
| Support / Resistance 20 days | 52.41 / 55.53 |
| Data as of | 10 October 2026 03:00 WIB |
Disclaimer: This technical analysis is generated automatically from exchange data (via Yahoo Finance) and indicators calculated by JournalArta, for information and education only. The verdict and the entry, target and stop-loss levels are not investment advice or a solicitation to buy or sell any security. Investment decisions and their risks rest solely with the reader.
Track PYPL stock price daily: live levels, support/resistance and our full PYPL analysis history.