SBUX RSI Oversold: Stock Drops 2.64% (October 9, 2026)
On October 9, 2026: price 90.75 USD, trend downtrend, RSI 28.7, support 90.75, resistance 99.07. technical analysis of sbux stock. SBUX RSI Oversold — full…
Trend & Price Action
Oscillators & Momentum
The 14-day Relative Strength Index (RSI), a measure of recent buying and selling pressure, is 28.7, below the conventional 30 threshold for an oversold reading. That signals the decline has been unusually forceful in the period measured. It can precede a bounce, but oversold conditions can persist while a downtrend remains intact. The Stochastic reading is neutral, with %K at 36.2 and %D at 39.8. Unlike the RSI, it does not yet show a clear turn higher. The MACD offers a limited counterpoint: its reading is -2.354, just above the -2.379 signal line, leaving a slightly positive histogram of 0.024. This suggests short-term downward momentum may be easing, but both MACD lines remain below zero, so the broader momentum picture is still weak. [ GRAFIK-MOMENTUM ]Volatility, Volume & Key Levels
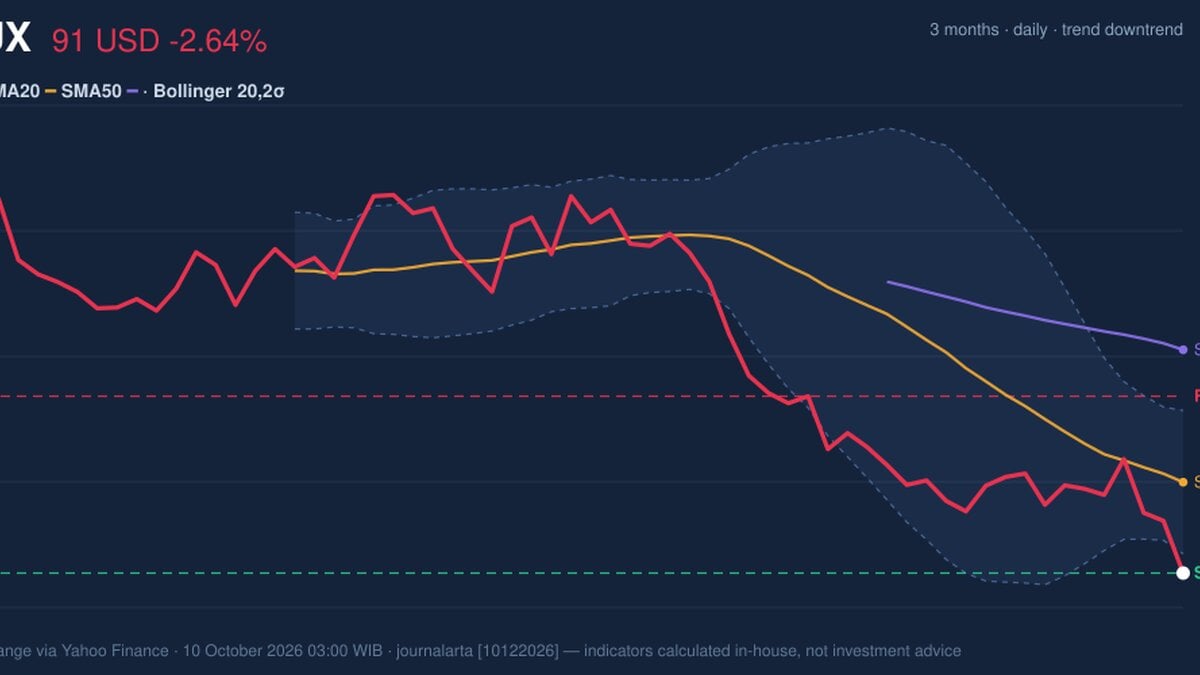
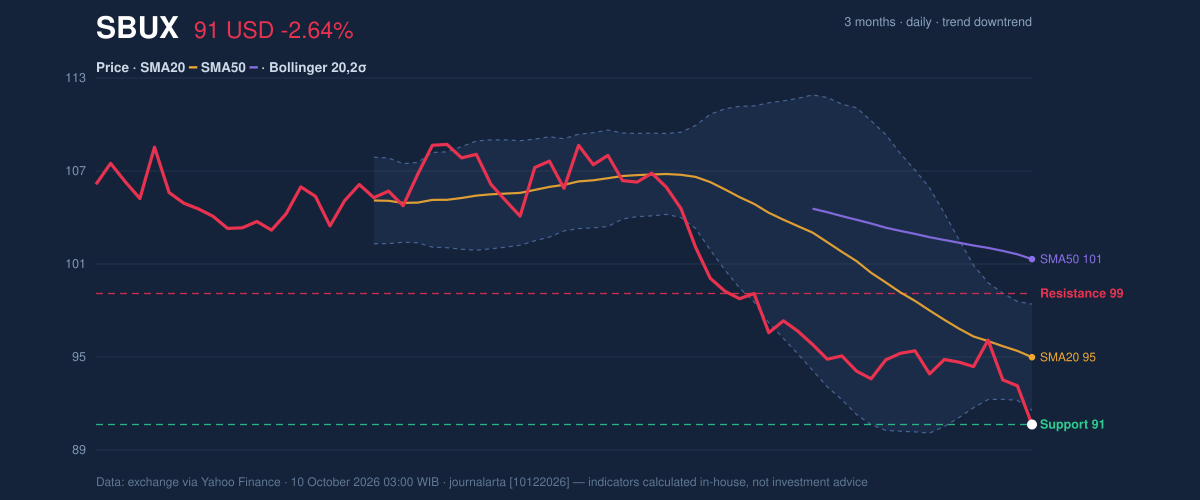
Volume reached 12,763,400 shares, or 1.4 times the 20-day average of 8,953,265. Higher volume during a decline indicates that the move attracted more participation than usual. On-Balance Volume (OBV), which tracks whether volume is flowing more with rising or falling prices, is also declining—another sign that buying has not yet convincingly absorbed the selling. Average True Range (ATR) is $2.30, equal to 2.5% of the share price. ATR measures typical price movement, not direction; here it indicates moderate daily volatility around a stock already testing a key short-term floor. The $90.75 20-day support is the immediate level to watch, although the latest close sits on it, leaving little evidence of a rebound so far. If that level fails, the three-month low of $87.35 is the next clearly defined reference in the supplied data. On recovery, the lower Bollinger Band at $91.65 is the first nearby hurdle, followed by the SMA20 at $95.02. The 20-day resistance is $99.07. A move back above the averages would offer stronger evidence of trend repair than an oversold bounce alone.Technical Verdict: HOLD (wait & see)
The indicators are mixed, but the trend and volume evidence lean bearish while oversold momentum and a slightly positive MACD histogram leave room for a short-term rebound. The verdict rests on three signals: price below falling moving averages; RSI at 28.7 and below the lower Bollinger Band; and heavier trading with declining OBV. It is invalidated if the price falls below $87.35, the three-month low.- Ideal entry range: $91.65–$95.02, spanning the lower Bollinger Band and SMA20; this is a technical reference zone, not a prediction of recovery.
- Exit target: $99.07, the 20-day resistance.
- Stop-loss protection: below $87.35, the three-month low.
Market data: exchange data via Yahoo Finance, as of October 10, 2026, 03:00 WIB. Technical analysis is not an investment recommendation.
Why SBUX is in focus today
- Closed at a 20-day low (90.75)
- RSI(14) at 28.7 — oversold zone
- Breaking out of a Bollinger squeeze (band width 7.1%)
- Downtrend extending (5-day change -4.18%)
Selected automatically from 32 NASDAQ (US) stocks by a technical-signal score with daily weighted randomisation — not a recommendation.
Summary Data SBUX
| Last price | 90.75 USD |
| Change 1 day / 5 days / 1 month | -2.64% / -4.18% / -8.09% |
| Trend / MA-cross | downtrend / none |
| SMA20 / SMA50 | 95.02 / 101.26 |
| RSI (14) / Stochastic %K | 28.7 / 36.2 |
| Bollinger %B / ATR | -13% / 2.30 |
| Support / Resistance 20 days | 90.75 / 99.07 |
| Data as of | 10 October 2026 03:00 WIB |
Disclaimer: This technical analysis is generated automatically from exchange data (via Yahoo Finance) and indicators calculated by JournalArta, for information and education only. The verdict and the entry, target and stop-loss levels are not investment advice or a solicitation to buy or sell any security. Investment decisions and their risks rest solely with the reader.
Track SBUX stock price daily: live levels, support/resistance and our full SBUX analysis history.