TMUS Stock Technicals: Drops 13.27% on Friday, RSI Oversold
On October 9, 2026: price 148.58 USD, trend downtrend, RSI 29.0, support 148.58, resistance 182.90. technical analysis of tmus stock. TMUS Stock Technicals —…
Why TMUS is in focus today
- One-day move of -13.27%, about 4.0× its average daily range (ATR)
- Volume at 3.2× the 20-day average
- Closed at a 20-day low (148.58)
- Trading near its 3-month low (147.90)
- RSI(14) at 29.0 — oversold zone
- MACD histogram has just turned negative
- Downtrend extending (5-day change -9.20%)
Selected automatically from 32 NASDAQ (US) stocks by a technical-signal score with daily weighted randomisation — not a recommendation.
Trend & Price Action
The decline extends a broader slide: shares lost 9.20% over five trading days and 18.51% over one month. The price is below both its 20-day simple moving average, or SMA20, at $166.72, and its 50-day average at $174.85. The SMA20 is also falling, down 2.40% over five days. These averages smooth out daily fluctuations; when the price sits beneath both and the shorter average is declining, the prevailing price structure remains weak. There has been no new moving-average cross, so the immediate signal comes from the distance between price and those averages rather than a fresh crossover. The stock is at the low end of its 20-day range and near its three-month low of $147.90, compared with a three-month high of $198.86. The market is therefore testing an important area, but proximity to a low is not itself evidence that selling has ended. As shown in the chart, the price has fallen below the lower Bollinger Band, now at $152.67. Bollinger Bands mark a range around a moving average; a move outside the band can indicate an unusually stretched decline, but does not guarantee a rebound. The band width is 16.9%, described as normal, so the move is not accompanied by an exceptionally narrow, compressed trading range.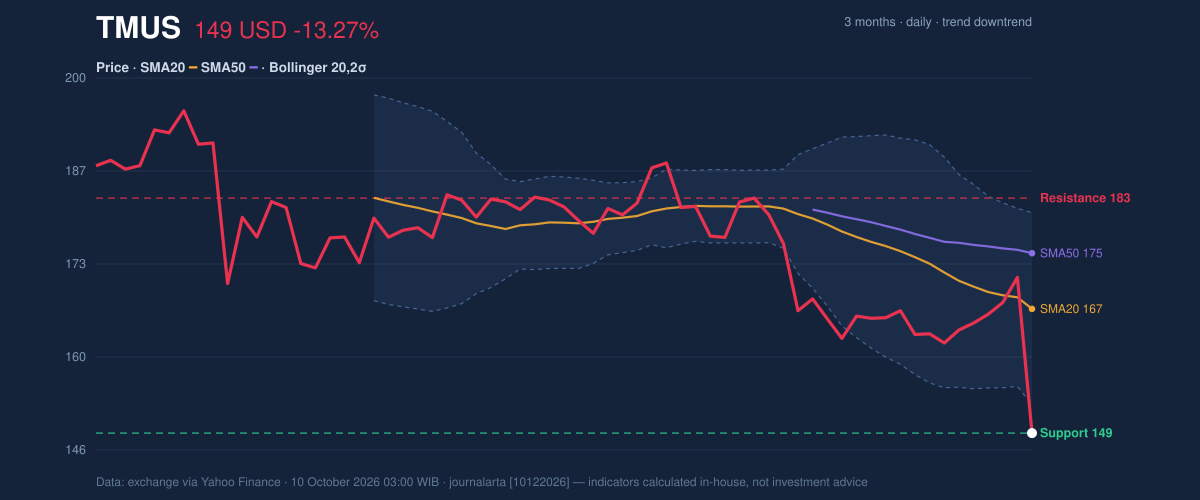
Oscillators & Momentum
Momentum readings show the tension between an established downtrend and a market that may be oversold. The 14-day RSI, a measure of recent gains versus losses, is 29.0, in oversold territory. The Stochastic oscillator is also deeply depressed: %K is 2.8 against %D at 58.2. Such readings indicate that selling has been intense relative to recent trading, but they are not a reliable timing signal on their own; weak shares can remain oversold while the trend persists. The MACD reinforces the bearish reading. Its value is -4.319, below its signal line at -4.003, and the histogram is negative at -0.316. The histogram has newly turned negative, suggesting downward momentum has gained the upper hand. In plain terms, the oversold readings flag a stretched decline, while MACD says the move has not yet produced a clear momentum reversal.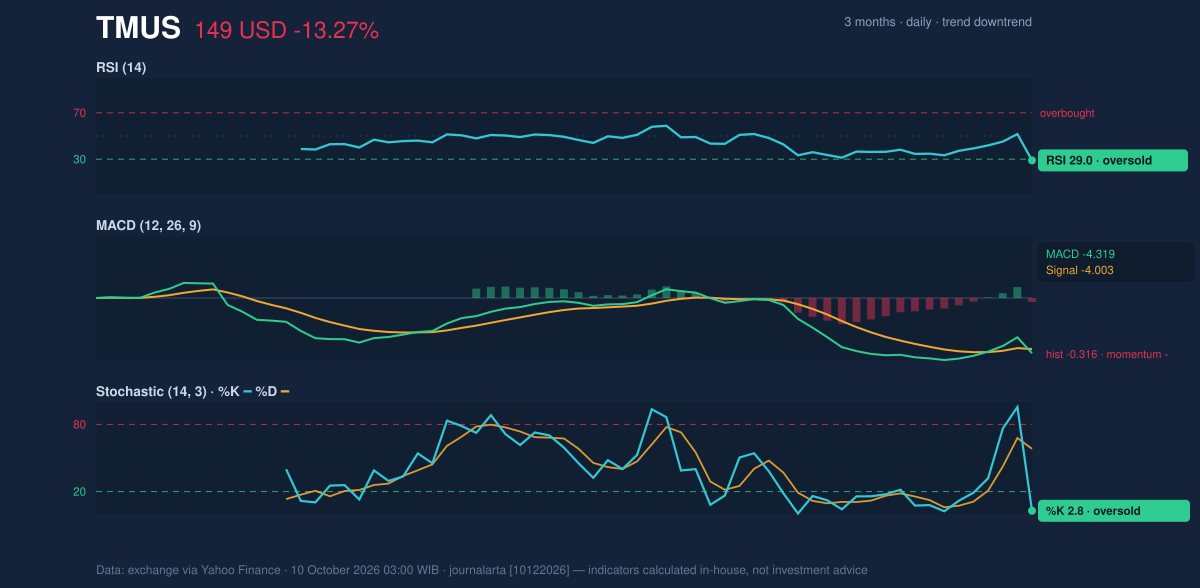
Volatility, Volume & Key Levels
The average true range, a measure of typical price movement, is $4.87, or 3.3% of the share price. That points to moderate underlying volatility, but the latest fall—around four times that average range—stands out as an exceptional session. Elevated turnover confirms broad participation in the move. On the other hand, On-Balance Volume (OBV), which tracks whether volume is heavier on rising or falling sessions, is rising. That is a counter-signal, though it does not outweigh the sharp price drop by itself. The immediate reference is $148.58, the 20-day support level and closing price. The three-month low at $147.90 is close beneath it. If the stock holds that area, oversold readings and rising OBV may help stabilize trading; a break below the three-month low would instead show that the decline has extended to a fresh range extreme. Above the market, $152.67 is the lower Bollinger Band, followed by the $166.72 SMA20 and $182.90 resistance. A recovery through those levels would be needed to challenge the current downtrend more convincingly.Technical Verdict: HOLD (wait & see)
The indicators support a cautious, wait-and-see verdict rather than a directional call: the price remains below falling short-term and longer-term averages; MACD momentum is negative; and the unusually heavy volume accompanied a steep decline. RSI and Stochastic are oversold, while rising OBV offers a counterweight, but neither establishes that a bottom is in place. The verdict is invalidated if the price falls below $147.90, the three-month low.- Ideal entry range: $148.58–$152.67, around the 20-day support and lower Bollinger Band; this is a technical reference, not a recommendation.
- Exit target: $166.72, the SMA20; the next resistance reference is $182.90.
- Stop-loss protection: Below $147.90, the three-month low.
| Indicator | Reading |
|---|---|
| Last price | $148.58 |
| Change | -13.27% daily; -9.20% over five days; -18.51% over one month |
| SMA20 / SMA50 | $166.72 / $174.85 |
| RSI(14) | 29.0, oversold |
| Stochastic | %K 2.8 / %D 58.2 |
| MACD / signal / histogram | -4.319 / -4.003 / -0.316 |
| Bollinger Bands | Upper $180.77; middle $166.72; lower $152.67 |
| ATR(14) | $4.87, or 3.3% |
| Volume / 20-day average | 18,978,100 / 5,932,470 |
| 20-day support / resistance | $148.58 / $182.90 |
| Three-month high / low | $198.86 / $147.90 |
Summary Data TMUS
| Last price | 148.58 USD |
| Change 1 day / 5 days / 1 month | -13.27% / -9.20% / -18.51% |
| Trend / MA-cross | downtrend / none |
| SMA20 / SMA50 | 166.72 / 174.85 |
| RSI (14) / Stochastic %K | 29.0 / 2.8 |
| Bollinger %B / ATR | -15% / 4.87 |
| Support / Resistance 20 days | 148.58 / 182.90 |
| Data as of | 10 October 2026 03:00 WIB |
Disclaimer: This technical analysis is generated automatically from exchange data (via Yahoo Finance) and indicators calculated by JournalArta, for information and education only. The verdict and the entry, target and stop-loss levels are not investment advice or a solicitation to buy or sell any security. Investment decisions and their risks rest solely with the reader.
Track TMUS stock price daily: live levels, support/resistance and our full TMUS analysis history.