ABBV Stock Gains 1.68%, RSI Overbought In Focus
On October 12, 2026: price 281.12 USD, trend uptrend, RSI 75.2, support 259.93, resistance 281.12. technical analysis of abbv stock. ABBV Stock Gains — full…
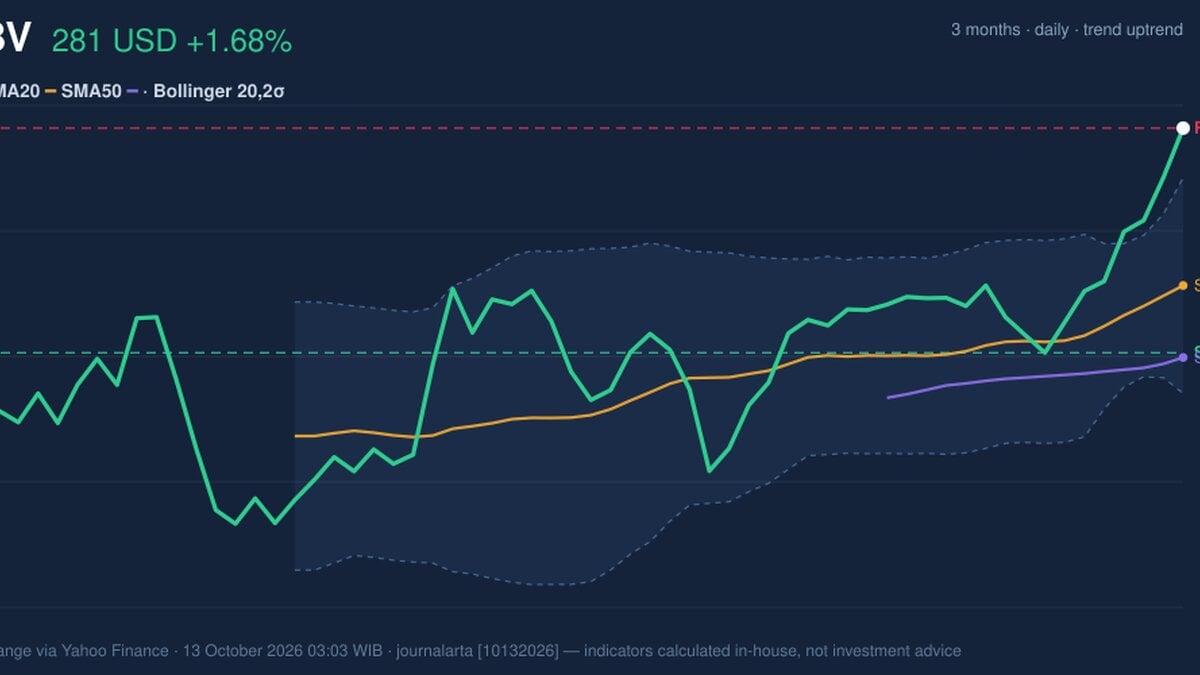
Why ABBV is in focus today
- Closed at a 20-day high (281.12)
- Trading near its 3-month high (281.30)
- RSI(14) at 75.2 — overbought zone
- Breaking out of a Bollinger squeeze (band width 7.6%)
- Uptrend confirmed (5-day change 5.78%)
Selected automatically from 30 NYSE (US) stocks by a technical-signal score with daily weighted randomisation — not a recommendation.
Trend & Price Action
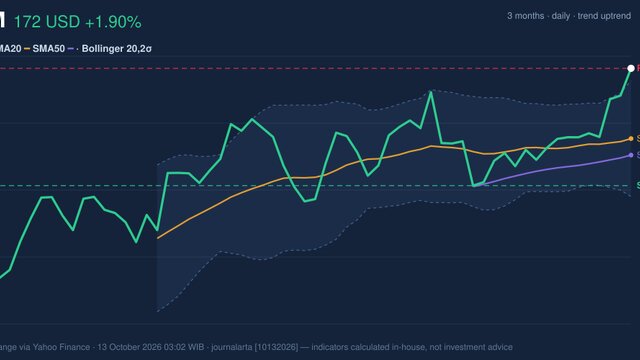
The technical picture favors the upside. AbbVie trades above its 20-day simple moving average (SMA), at $266.27, and its 50-day SMA, at $259.50. The 20-day average is rising, up 1.81% over five days, while the stock’s five-day gain suggests that demand has accelerated rather than merely held steady. There has been no new crossover between the averages, so the evidence is a strengthening existing uptrend, not a fresh signal from a moving-average cross. The latest close sits at the top of the 20-day range and near the three-month peak. That positioning confirms buyers have control, but leaves little room between the current price and the nearest recorded high. As shown in the chart, the price has also moved above the upper Bollinger Band at $276.45. Bollinger Bands track price movement around an average; a close beyond the upper band can reflect strong momentum, but it can also indicate that price has outrun its recent norm.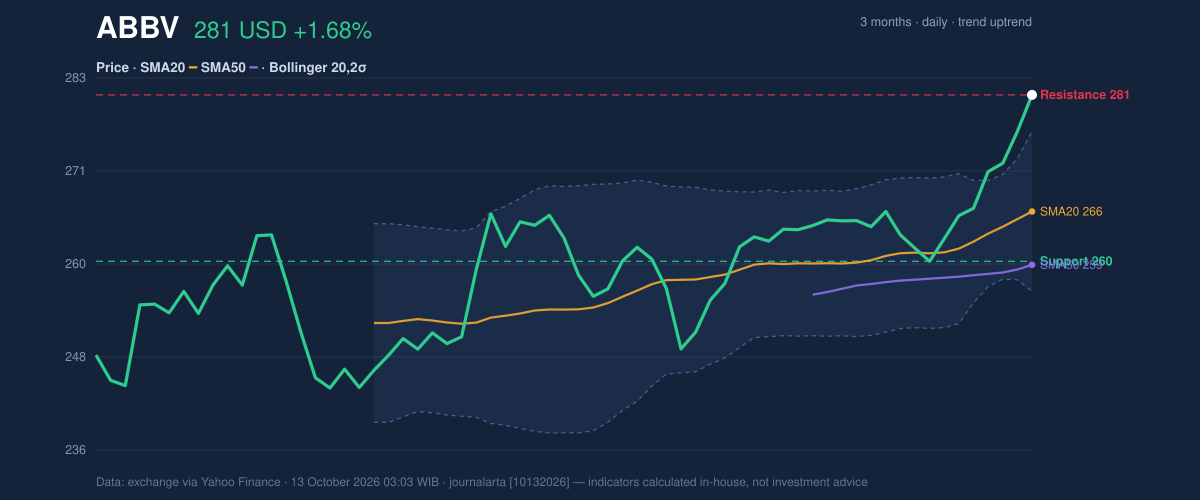
Oscillators & Momentum
Momentum indicators broadly confirm the uptrend, though they also warn against assuming the advance can continue at the same pace. The RSI is 75.2, in overbought territory; the RSI measures the speed and scale of recent price moves, and readings above 70 are commonly treated as a sign that the market may be due for a pause. The Stochastic is also overbought, with %K at 99.2 and %D at 92.9, placing both readings near the top of their scale. That is not, by itself, a reversal signal. The MACD remains positive: its reading of 4.210 is above its 2.752 signal line, with a positive 1.458 histogram. This indicates upward momentum is still stronger than the recent baseline. As shown in the chart, the key question is whether that positive MACD can persist while the faster oscillators cool.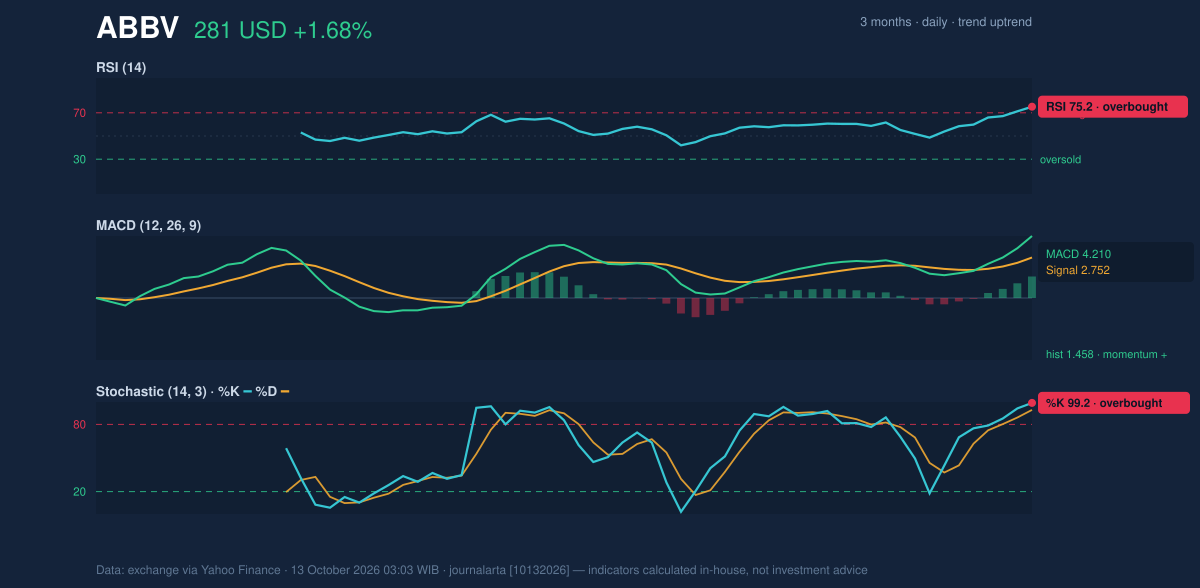
Volatility, Volume & Key Levels
The Bollinger Band width is 7.6%, and the data identify a narrowing-band squeeze followed by a move out of that range. A squeeze means recent price fluctuations have compressed; a subsequent breakout can mark a stronger move, though the band itself does not establish which direction will prevail. Here, the move is upward, with the stock at 123% of the band range (%B), beyond the upper boundary. Trading activity adds support to the advance: volume was 5,593,700 shares, about 1.2 times its 20-day average, and on-balance volume (OBV)—a measure that accumulates volume on rising days and subtracts it on falling days—was rising. That points to broader participation rather than a price rise on unusually thin trading. Average true range (ATR), a measure of typical price movement, was $5.82, or 2.1% of the share price, indicating moderate volatility. The 20-day support is $259.93, while $281.12 is the stated 20-day resistance and current close. The three-month high of $281.30 is the immediate reference point above price. A sustained move beyond that high would extend the breakout; failure to hold above the upper band could instead bring a retreat toward the rising moving averages. A fall below $259.93 would materially weaken the near-term structure.Technical Verdict: HOLD (wait & see)
The verdict reflects the clash between a confirmed rising trend and short-term exhaustion risk. The 20-day SMA is rising and price is above both moving averages; positive MACD and rising OBV support the advance. But RSI and Stochastic are both overbought, while price has exceeded the upper Bollinger Band and is pressing against the three-month high. - Ideal Entry Range: $266.27–$276.45, between the 20-day SMA and upper Bollinger Band. - Exit Target (Target Price): $281.30, the three-month high and the next stated reference level. - Stop Loss protection: $259.93, the 20-day support level. - Invalidation: The verdict is invalidated if price falls below $259.93. For non-traders, the chart still points upward, but its strongest short-term signals say the advance may need to cool before its direction is clearer.| Indicator | Reading |
|---|---|
| Last price | $281.12 |
| Daily / five-day change | +1.68% / +5.78% |
| SMA20 / SMA50 | $266.27 / $259.50 |
| RSI(14) | 75.2 — overbought |
| Stochastic %K / %D | 99.2 / 92.9 — overbought |
| MACD / signal / histogram | 4.210 / 2.752 / 1.458 — positive momentum |
| Bollinger upper / middle / lower | $276.45 / $266.27 / $256.10 |
| 20-day support / resistance | $259.93 / $281.12 |
| Three-month high / low | $281.30 / $241.20 |
| ATR(14) | $5.82 (2.1%) |
| Volume / 20-day average | 5,593,700 / 4,582,565 |
Summary Data ABBV
| Last price | 281.12 USD |
| Change 1 day / 5 days / 1 month | 1.68% / 5.78% / 7.39% |
| Trend / MA-cross | uptrend / none |
| SMA20 / SMA50 | 266.27 / 259.50 |
| RSI (14) / Stochastic %K | 75.2 / 99.2 |
| Bollinger %B / ATR | 123% / 5.82 |
| Support / Resistance 20 days | 259.93 / 281.12 |
| Data as of | 13 October 2026 03:03 WIB |
Disclaimer: This technical analysis is generated automatically from exchange data (via Yahoo Finance) and indicators calculated by JournalArta, for information and education only. The verdict and the entry, target and stop-loss levels are not investment advice or a solicitation to buy or sell any security. Investment decisions and their risks rest solely with the reader.
Track ABBV stock price daily: live levels, support/resistance and our full ABBV analysis history.