AMAT Momentum Gains: Stock Drops 1.87% (October 12, 2026)
On October 12, 2026: price 497.53 USD, trend sideways, RSI 50.6, support 415.38, resistance 542.28. technical analysis of amat stock. AMAT Momentum Gains —…
Trend & Price Action
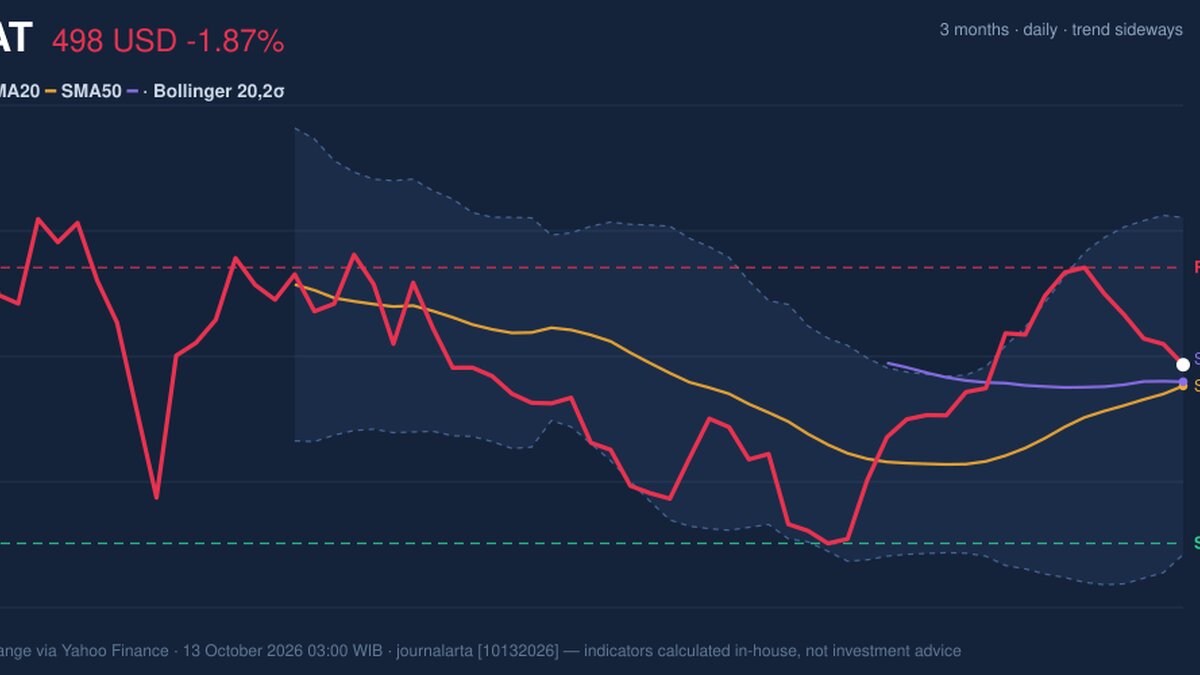
The stock is down 8.25% over five days but up 17.28% over one month, a contrast that points to a near-term retreat within a stronger recent advance—not yet a clear reversal. The broader trend is classified as sideways. Applied Materials remains above its 20-day average of $487.78, and that average has risen 3.05% over five days, suggesting short-term underlying support despite the latest weakness. Its 50-day average is $489.74, slightly above the 20-day average. There has been no new crossover between the two, so the averages do not yet confirm a decisive shift in trend. The share price sits about 65% of the way through its 20-trading-day range, between support at $415.38 and resistance at $542.28. That position leaves room in either direction: the recent drop has not carried the price to the range floor, but resistance is still some distance above. The three-month high of $614.14 and low of $411.51 show how wide the stock’s recent swings have been. The current price is well below that high, while still above the three-month low, underscoring why the short-term averages and trading range are more useful here than treating the longer-period extremes as immediate signals.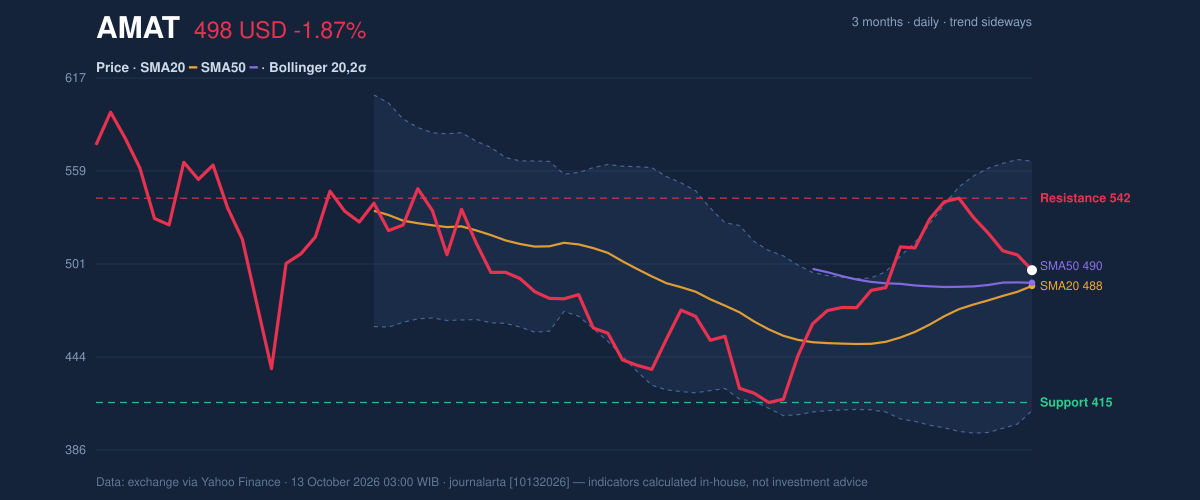
Oscillators & Momentum
Momentum indicators are not aligned strongly enough to confirm either a fresh advance or a breakdown. The relative strength index, or RSI—a measure of the speed and scale of recent price moves—stands at 50.6, a neutral reading. The stochastic indicator, which compares the latest close with its recent trading range, is also neutral: %K is 42.7 and %D is 53.3. With %K below %D, the faster measure is weaker, but neither reading signals an extreme condition. The MACD, a trend-following measure that compares short- and longer-term price momentum, remains positive: 11.176 versus a 9.540 signal line, with a positive histogram of 1.636. That points to residual upward momentum, even as the five-day decline and falling on-balance volume—the cumulative measure of buying and selling activity—suggest that recent trading has not strongly confirmed it. The volume comparison reinforces the caution. Trading volume was 4,169,800 shares, about 0.7 times the 20-day average of 6,043,275. A decline on thinner-than-normal volume can indicate limited participation in the move, though it does not by itself establish that the selling pressure has ended.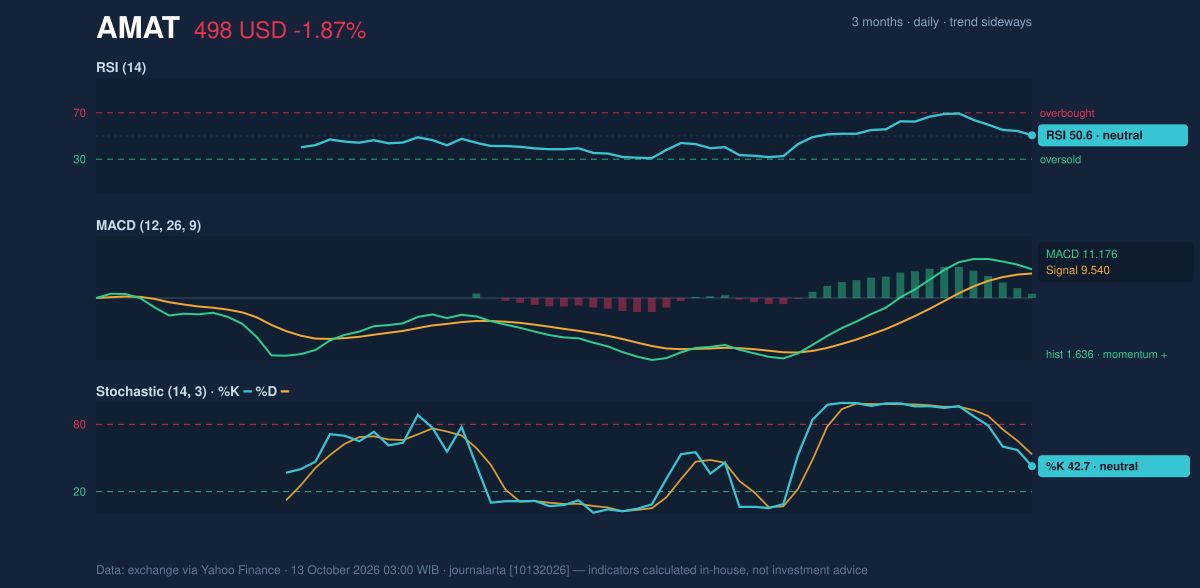
Volatility & Key Levels
The Bollinger Bands, which plot a moving average with upper and lower boundaries based on price variability, are widening. Their 31.8% width signals elevated volatility, while the price’s 56% position between the lower and upper bands places it modestly above the midpoint—not near either boundary. The upper band is $565.31 and the lower band is $410.25. Widening bands mean price swings are becoming larger; they do not, on their own, identify which direction comes next. Average true range, a measure of typical daily movement, is $16.57, or 3.3% of the share price, consistent with moderate volatility. The key nearer-term test is the moving-average area around $487.78–$489.74. Holding above it would keep the price above both averages; a sustained move below would weaken that support picture. On the upside, a push toward $542.28 would test the 20-day resistance, while a failure to hold the averages could expose lower levels, including the broader range support at $415.38.Technical Verdict: HOLD (wait & see)
HOLD (wait & see) fits the conflicting evidence: the share price remains above the rising 20-day average, MACD is positive, but RSI and stochastic are neutral, volume is below average, and OBV is falling. The verdict is invalidated if the price falls below $487.78, the 20-day average, which would remove the clearest nearby trend support in the supplied data.- Ideal entry range: $487.78–$489.74, the 20- and 50-day averages, as a technical reference zone rather than a recommendation.
- Exit target: $542.28, the 20-trading-day resistance level.
- Stop-loss protection: below $487.78, aligned with the 20-day average and the stated invalidation level.
Market data: exchange data via Yahoo Finance, as of October 13, 2026, 03:00 WIB. Technical analysis is not an investment recommendation.
Summary Data AMAT
| Last price | 497.53 USD |
| Change 1 day / 5 days / 1 month | -1.87% / -8.25% / 17.28% |
| Trend / MA-cross | sideways / none |
| SMA20 / SMA50 | 487.78 / 489.74 |
| RSI (14) / Stochastic %K | 50.6 / 42.7 |
| Bollinger %B / ATR | 56% / 16.57 |
| Support / Resistance 20 days | 415.38 / 542.28 |
| Data as of | 13 October 2026 03:00 WIB |
Disclaimer: This technical analysis is generated automatically from exchange data (via Yahoo Finance) and indicators calculated by JournalArta, for information and education only. The verdict and the entry, target and stop-loss levels are not investment advice or a solicitation to buy or sell any security. Investment decisions and their risks rest solely with the reader.
Track AMAT stock price daily: live levels, support/resistance and our full AMAT analysis history.