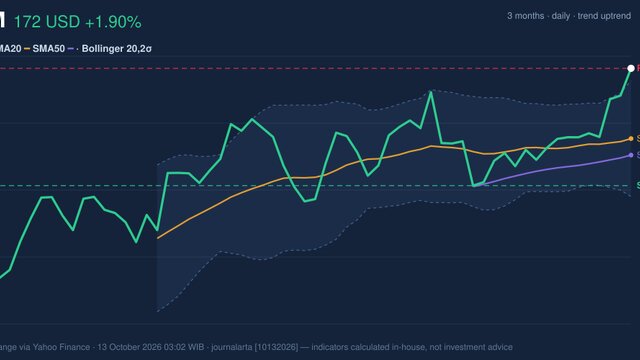
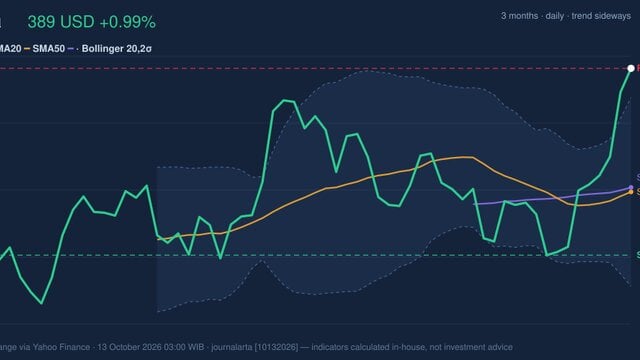
On October 12, 2026: price 959.44 USD, trend sideways, RSI 67.4, support 893.74, resistance 959.44. technical analysis of cost stock. COST Testing Key…
By Elena Vance
October 13, 20264 min read
COST Testing Key Resistance
Costco Wholesale rose 1.32% on the Nasdaq to $959.44 on Oct. 13, putting the retailer at the top of its 20-trading-day range and just above its upper Bollinger Band. The stock is worth watching because JournalArta has not covered it in the past 14 days, while the latest move combines positive MACD momentum with a heavily stretched Stochastic reading. The price data are from Yahoo Finance.
Trend & Price Action
Costco is up 3.89% over five days and 4.41% over one month, but the broader technical label remains sideways. That distinction matters: recent gains are firm, yet the data do not show a newly established longer-term trend. The stock is above its 20-day moving average of $917.77, and that average is rising 1.06% over five days. But the 20-day average remains below the 50-day average at $931.58, with no new moving-average crossover. There is therefore no fresh “golden cross” signal — a pattern in which a shorter-term average moves above a longer-term one.
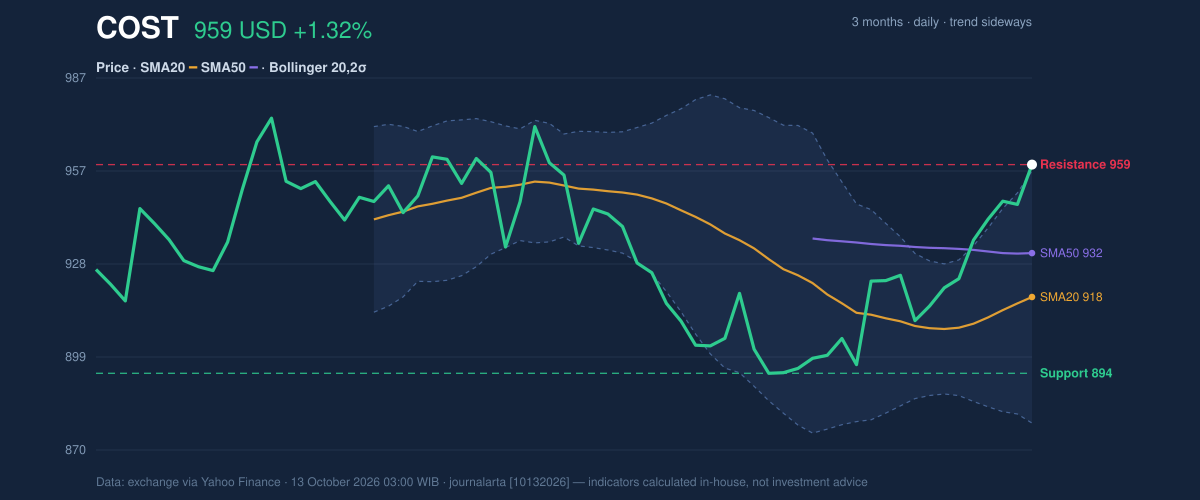
Costco has reached the top of its 20-day range, at $959.44 resistance, and sits above the upper Bollinger Band at $957.44. Bollinger Bands plot a typical range around a moving average; a move beyond the upper band can reflect strong momentum, but it also means price has stretched beyond its recent norm. The stock remains below its three-month high of $987.55.
The move is strong, but not yet a confirmed breakout.
As shown in the chart, the price is pressing the near-term ceiling while remaining above its rising 20-day average.
3-month price action chart of COST: price, SMA20/50, Bollinger, support & resistance. Data: exchange via Yahoo Finance.
Oscillators & Momentum
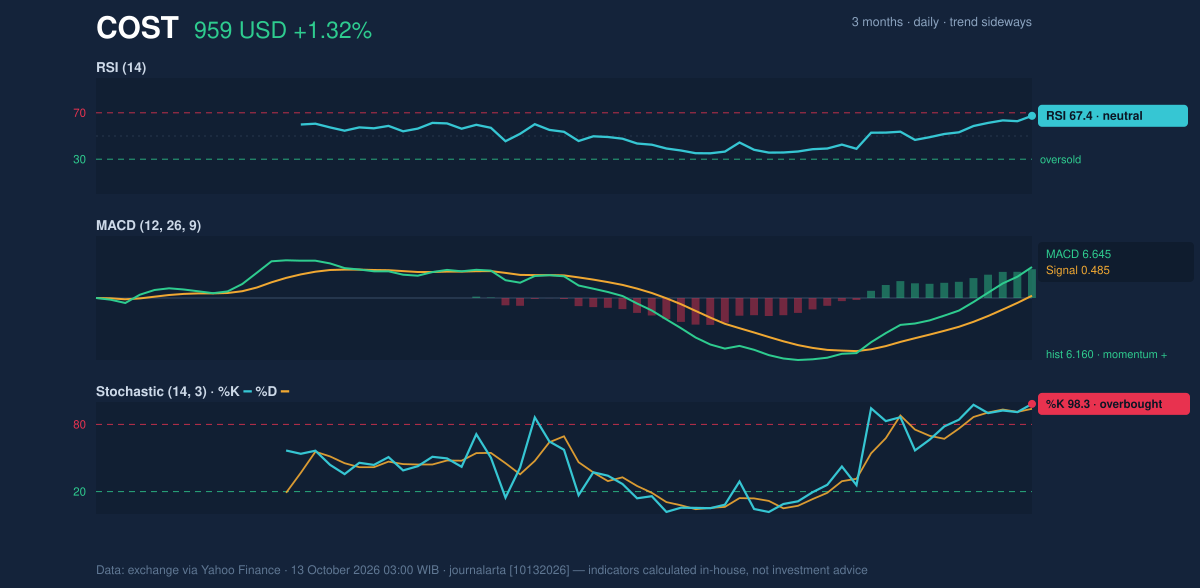
The indicators give a mixed reading. MACD, a measure comparing short- and longer-term price momentum, is positive at 6.645 against a signal line of 0.485; its histogram is also positive at 6.160. This supports the recent advance rather than contradicting it. RSI, which measures the speed of price changes, stands at 67.4, in neutral territory according to the supplied data.
The caution comes from the Stochastic oscillator, which compares a closing price with its recent trading range. Its %K reading is 98.3 and %D is 93.9, both signaling overbought conditions. That does not establish that a reversal has begun, but it shows that the advance is crowded near the top of its recent range. If momentum cools, the stock could retreat even while its broader trend remains intact.
The MACD confirms strength; Stochastic warns that the move may be overheated.
Momentum chart of COST: RSI(14), MACD, Stochastic. Data: exchange via Yahoo Finance.
Volatility, Volume & Key Levels
The Bollinger Band width is 8.6%, described as normal rather than compressed or sharply expanding. The %B reading of 103% means the price is just beyond the upper band, reinforcing the stretched near-term setup. Average True Range, a gauge of typical daily movement, is $16.04, or 1.7% of the share price, indicating moderate volatility rather than an unusually wide trading range.
Trading participation was lighter than the price move might suggest: volume was 1,478,800 shares, about 0.6 times the 20-day average of 2,341,805. On-Balance Volume, which tracks whether volume tends to accompany rising or falling prices, is rising. That offers some support for the advance, although below-average turnover makes the push through resistance less firmly confirmed.
The key near-term level is $959.44 resistance; a sustained move above it would clear the 20-day range ceiling, though the data do not establish how long such a move would last. If the stock fails to hold its gains, the rising 20-day average at $917.77 is a reference point, with 20-day support at $893.74 below it. A fall under that support would weaken the current short-term structure. The three-month low is $883.10.
Technical Verdict: HOLD (wait & see)
The indicators support a neutral stance rather than a directional call. MACD is positive and the 20-day average is rising, but price is at resistance, above the upper Bollinger Band and paired with overbought Stochastic readings. Below-average volume also leaves the attempt to move beyond the range ceiling short of strong confirmation.
Ideal entry range: $917.77–$931.58, around the 20-day and 50-day moving averages.
Exit target: $987.55, the three-month high and next marked reference level above current resistance.
Stop-loss protection: $893.74, the 20-day support level.
The verdict is invalidated if the price falls below $893.74.
For non-traders, the signals show a rising stock that is testing its ceiling, but the move is stretched enough to warrant waiting for clearer confirmation.
As of Oct. 13, Costco’s last price was $959.44.
Summary Data COST
Last price
959.44 USD
Change 1 day / 5 days / 1 month
1.32% / 3.89% / 4.41%
Trend / MA-cross
sideways / none
SMA20 / SMA50
917.77 / 931.58
RSI (14) / Stochastic %K
67.4 / 98.3
Bollinger %B / ATR
103% / 16.04
Support / Resistance 20 days
893.74 / 959.44
Data as of
13 October 2026 03:00 WIB
Disclaimer: This technical analysis is generated automatically from exchange data (via Yahoo Finance) and indicators calculated by JournalArta, for information and education only. The verdict and the entry, target and stop-loss levels are not investment advice or a solicitation to buy or sell any security. Investment decisions and their risks rest solely with the reader.