On October 12, 2026: price 305.99 USD, trend sideways, RSI 52.9, support 268.03, resistance 329.27. technical analysis of intu stock. INTU Stock Gains — full…
By Elena Vance
October 13, 20264 min read
INTU Stock Gains 1.07%, Momentum Gains In Focus
Intuit shares rose 1.07% to $305.99 on October 13, after gaining 7.49% over five trading days, a rebound that has not yet erased a 9.78% decline over the past month. The stock is worth watching because JournalArta has not covered it in the past 14 days, while its short-term price recovery is testing a mixed technical picture. The gain came with volume close to its recent average.
Trend & Price Action
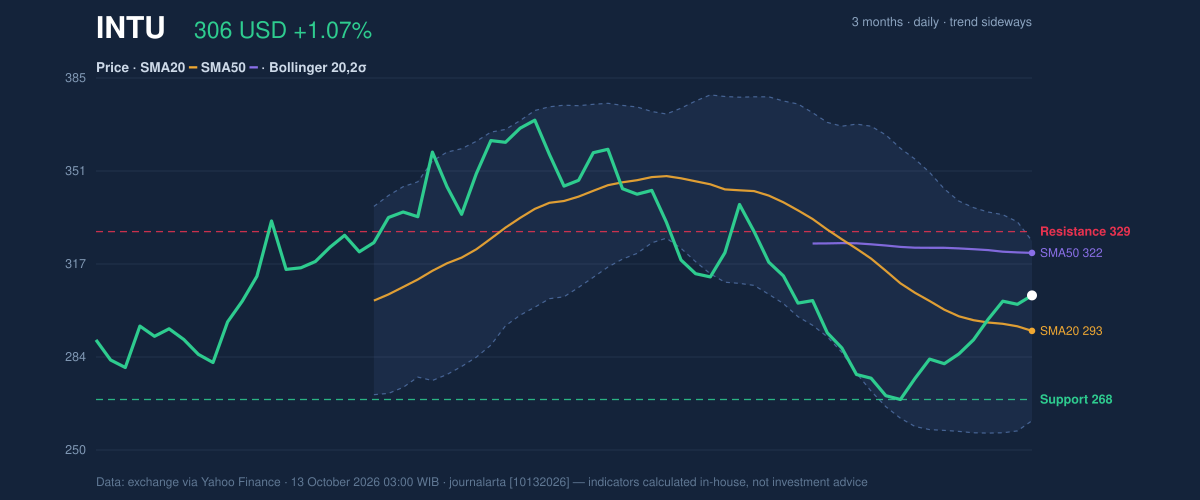
Intuit, which trades on the Nasdaq under the ticker INTU, is trading above its 20-day moving average but below its 50-day average. That split suggests short-term buyers have regained some ground, while the broader price trend remains under pressure. The 20-day average is also sloping down, declining 1.79% over five trading days, so the rebound has not yet shifted the underlying trend. There has been no recent moving-average crossover to confirm a change in direction.
The shares are 62% of the way through their 20-trading-day range, between support at $268.03 and resistance at $329.27. They remain well below the three-month high of $372.98, though above the three-month low of $262.32. This positioning puts the stock in the upper part of its recent trading range, but not yet at a level that would establish a breakout.
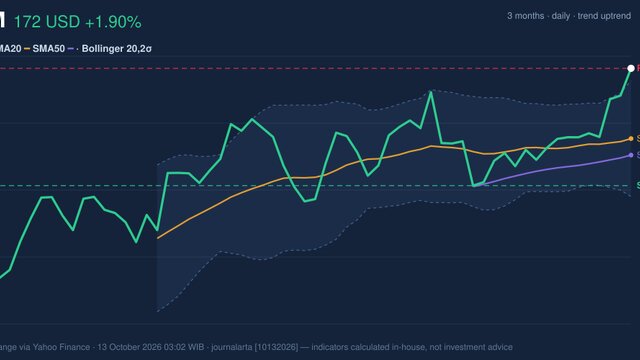
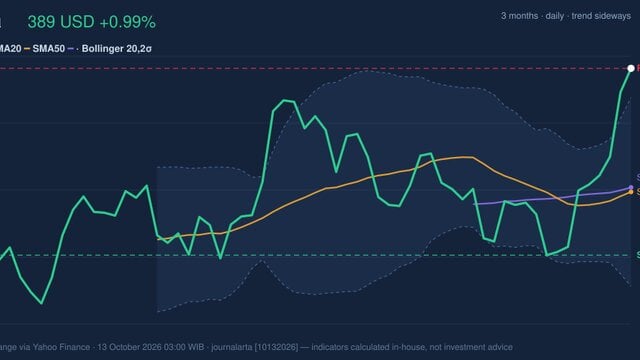
As shown in the chart, the Bollinger bands — a measure of how far prices are moving from their recent average — are widening. The bands span $260.28 to $325.84, with the middle line at $293.06. A 22.4% band width signals elevated price variability; the current reading at 70% of the band places shares nearer the upper boundary than the lower one. That can accompany a strong advance, but it also means the rally is occurring amid wider swings.
3-month price action chart of INTU: price, SMA20/50, Bollinger, support & resistance. Data: exchange via Yahoo Finance.
Oscillators & Momentum
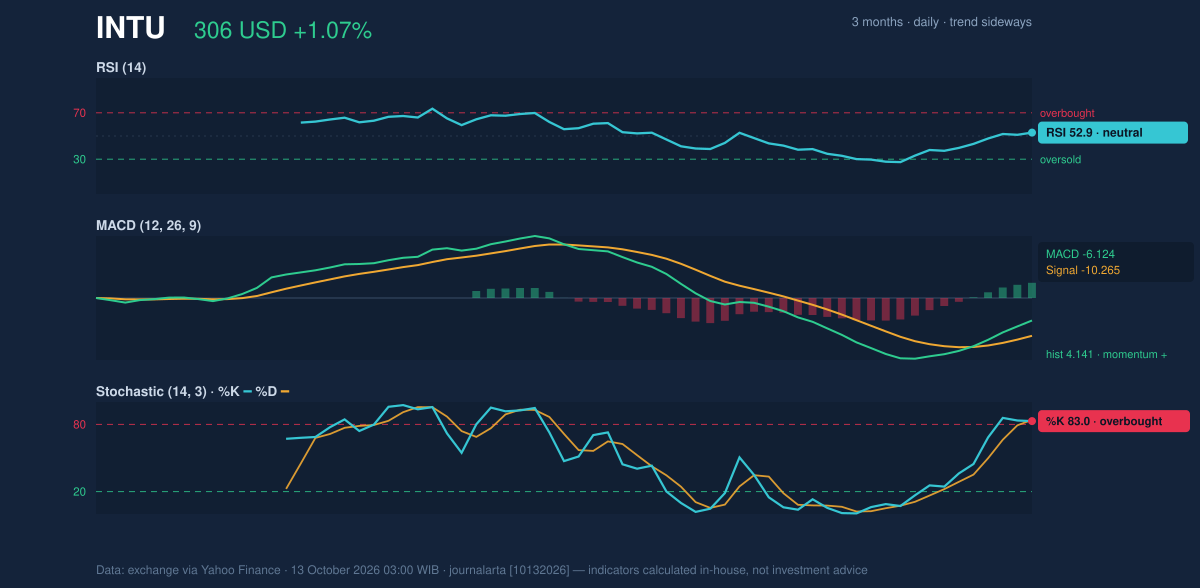
Momentum indicators are improving, but they do not all tell the same story. The RSI is 52.9, a neutral reading, consistent with a market that has recovered without showing strong directional conviction. The Stochastic is overbought, with %K at 83.0 and %D at 84.1. This indicator compares a recent closing price with its trading range; an overbought reading can signal that a short-term rally is stretched, but does not by itself establish that prices must fall.
The MACD histogram is positive at 4.141, while MACD itself remains negative at -6.124 against a signal line of -10.265. In plain terms, the gap between the two lines is improving, indicating that downward momentum has eased. Because both lines remain below zero, however, this is evidence of a recovery in momentum rather than confirmation of a fully established uptrend.
Momentum chart of INTU: RSI(14), MACD, Stochastic. Data: exchange via Yahoo Finance.
Volatility, Volume & Levels
Average true range, which estimates typical daily price movement, is $10.18, or 3.3% of the share price—a moderate reading. Combined with widening Bollinger bands, it points to meaningful price swings without implying that any single move is inevitable.
Trading volume was 3,940,200 shares, about 1.0 times the 20-day average of 3,853,220. That is near-normal participation, not a pronounced surge that would independently validate the advance. On-balance volume (OBV), which tracks whether trading volume tends to accompany rising or falling prices, is increasing. That is a constructive sign, though the modest volume comparison makes the confirmation less forceful.
The $329.27 resistance is close to the upper Bollinger band at $325.84, creating a nearby zone where further gains could meet selling pressure. A sustained move through that area would strengthen the case that the recovery is extending. If the stock turns lower, the $293.06 20-day average is an intermediate reference point, while $268.03 support is the more consequential boundary in the stated 20-day range. A break below it would undermine the recovery structure.
3-month price action chart of INTU: price, SMA20/50, Bollinger, support & resistance. Data: exchange via Yahoo Finance.
Technical Verdict: HOLD
The indicators support a cautious, wait-and-see stance. The price is above the 20-day average but below the 50-day average, leaving the trend unresolved. MACD momentum is improving, but its lines remain below zero, while the overbought Stochastic flags the possibility that the recent rebound may pause. Near-normal volume and rising OBV provide some support, but not decisive confirmation.
The verdict is invalidated if the price falls below $268.03, the stated 20-trading-day support.
- Ideal entry range: $293.06–$305.99, bounded by the 20-day average and last price.
- Exit target: $325.84–$329.27, using the upper Bollinger band and 20-day resistance.
- Stop-loss protection level: $268.03, at 20-day support.
For non-traders, HOLD means the rebound has improved the chart, but the indicators have not yet settled on a clear direction.
Metric
Reading
Last price
$305.99
20-day / 50-day moving average
$293.06 / $321.50
RSI / Stochastic
52.9 / 83.0 (%K), 84.1 (%D)
MACD / signal / histogram
-6.124 / -10.265 / 4.141
20-day support / resistance
$268.03 / $329.27
Data timestamp
October 13, 2026, 03:00 WIB
Summary Data INTU
Last price
305.99 USD
Change 1 day / 5 days / 1 month
1.07% / 7.49% / -9.78%
Trend / MA-cross
sideways / none
SMA20 / SMA50
293.06 / 321.50
RSI (14) / Stochastic %K
52.9 / 83.0
Bollinger %B / ATR
70% / 10.18
Support / Resistance 20 days
268.03 / 329.27
Data as of
13 October 2026 03:00 WIB
Disclaimer: This technical analysis is generated automatically from exchange data (via Yahoo Finance) and indicators calculated by JournalArta, for information and education only. The verdict and the entry, target and stop-loss levels are not investment advice or a solicitation to buy or sell any security. Investment decisions and their risks rest solely with the reader.