Momentum Weakens, META Stock Gains 3.38% on Monday
On October 12, 2026: price 742.96 USD, trend uptrend, RSI 62.0, support 665.75, resistance 777.59. technical analysis of meta stock. Momentum Weakens — full…
By Elena Vance
October 13, 20264 min read
Momentum Weakens, META Stock Gains 3.38% on Monday
Meta Platforms rose 3.38% to $742.96 on October 13, putting the stock above its rising 20-day average even as a short-term momentum gauge turned negative. The move is notable for another reason: JournalArta has not covered the stock in the past 14 days. Market data from Yahoo Finance show a wider uptrend remains intact, but the gap between rising prices and a weakening MACD suggests the advance is losing some immediate force.
Trend & Price Action
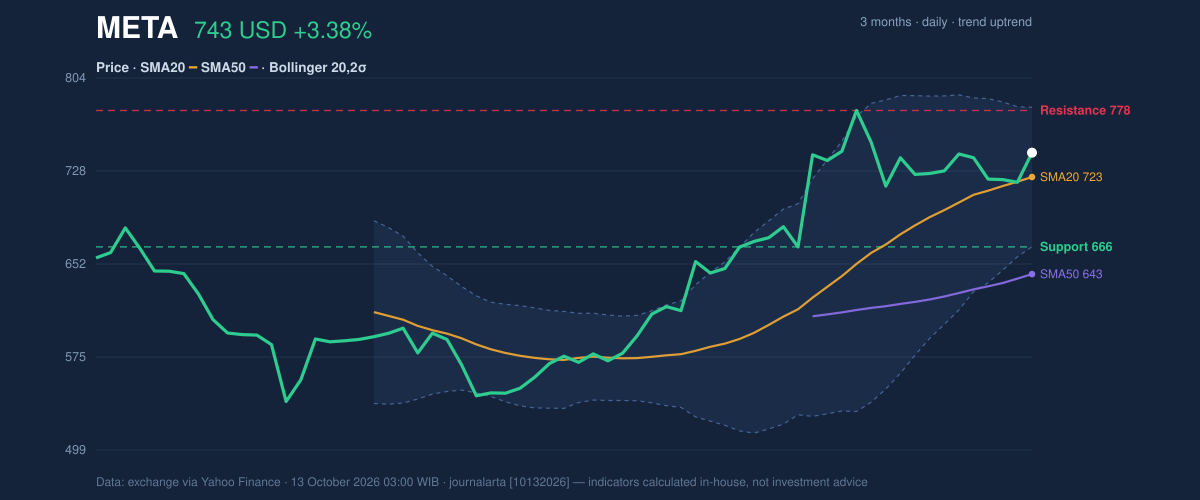
Meta’s shares are up 11.62% over one month and 0.14% over five days. The 20-day simple moving average, or SMA—a measure of the average closing price over that period—has climbed 2.97% in five days to $723.05. The stock is also well above its 50-day average of $643.46, a structure consistent with an established uptrend rather than a recent bounce from below longer-term support.
There has been no new crossover between the two averages, so the trend signal comes from their relative positions and the rising slope of the shorter average, not from a fresh technical trigger. Meta sits at 69% of its 20-day trading range, closer to resistance than support. Its three-month high is $779.82, while the 20-day resistance estimate is $777.59—levels that put the recent advance within reach of a test, but not yet a confirmed breakout.
The trend is upward, but the stock’s position near the upper end of its range leaves less room for a pullback before the advance would need to prove its durability.
The Bollinger Bands, which map price against a moving average and its recent volatility, run from $665.91 to $780.20, with the middle band at $723.05. Meta’s %B reading of 67% places it above the midpoint but below the upper band; the bands’ 15.8% width is described as normal, not unusually tight or expanded. That combination suggests an advance with room to move inside the current range, rather than a price already stretched beyond its volatility envelope.
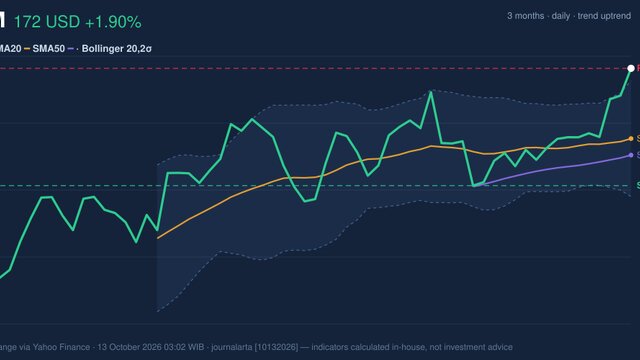
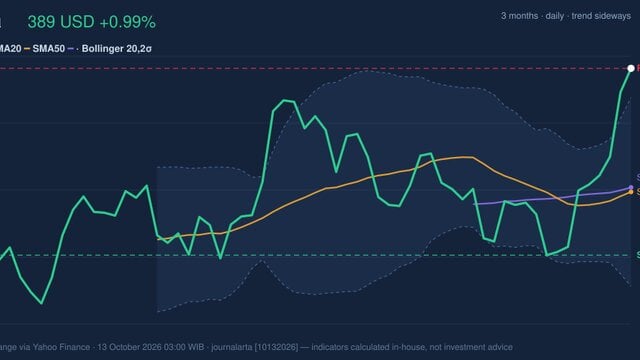
As shown in the chart, price is above the 20-day average and near the resistance zone, while the bands frame the distance to both the upper boundary and the middle line.
3-month price action chart of META: price, SMA20/50, Bollinger, support & resistance. Data: exchange via Yahoo Finance.
Oscillators & Momentum
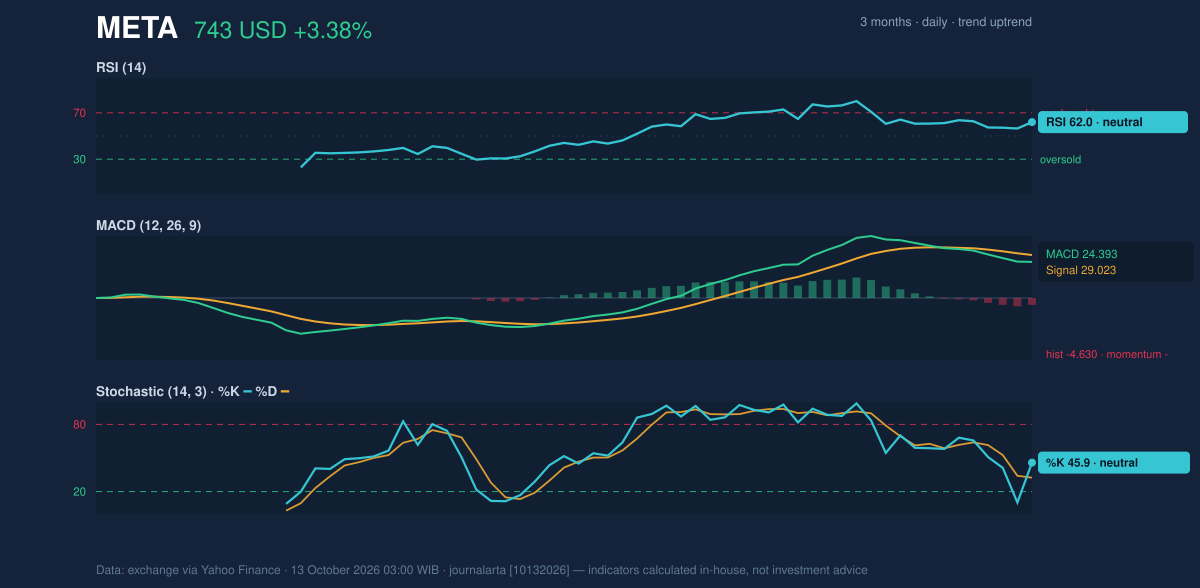
The momentum readings are mixed. RSI, a measure of the pace and strength of recent price changes, is 62.0 and classified as neutral. Stochastic %K is 45.9 and %D is 32.5, also neutral; neither reading signals an extreme condition in the supplied data. These indicators do not contradict the broader uptrend, but they offer limited evidence that buying pressure is accelerating.
MACD provides the clearest caution. Its reading of 24.393 is below the signal line at 29.023, leaving a negative histogram of -4.630. In plain terms, the price trend can still be rising while the latest momentum is weaker than its recent baseline. This is not, by itself, proof of a reversal, but it does temper the significance of the day’s gain.
RSI and Stochastic remain neutral, while MACD is negative—an uneven mix that points to a strong trend with softer near-term momentum. As shown in the chart, the MACD histogram is the key measure to watch alongside the two neutral oscillators.
Momentum chart of META: RSI(14), MACD, Stochastic. Data: exchange via Yahoo Finance.
Volatility, Volume & Key Levels
Trading volume was 24,828,300 shares, about 1.1 times its 20-day average of 21,962,550. On-balance volume, a running measure that adds volume on rising sessions and subtracts it on falling ones, is rising. That supports the idea that participation is backing the advance, although one above-average session does not establish a lasting shift in demand.
Average true range, or ATR, is $22.46, equal to 3.0% of the share price. That points to moderate day-to-day volatility: moves can be meaningful, but the supplied reading does not indicate an exceptional expansion in expected trading range.
The nearest chart-defined resistance is $777.59, close to the three-month high of $779.82. A sustained move through that area would put the upper Bollinger Band at $780.20 in view. On the downside, the 20-day SMA at $723.05 is the first important reference, followed by 20-day support at $665.75. A break below the moving average would weaken the short-term structure; a fall through the support zone would challenge the broader bullish setup.
Technical Verdict: HOLD
HOLD (wait & see) best reflects the conflicting signals: Meta remains above rising short- and longer-term averages, OBV is rising, and volume is above its 20-day norm. Against that, MACD momentum is negative, while price is already nearer resistance than support. The verdict is invalidated if the price falls below $665.75, the stated 20-day support.
Ideal Entry Range: $723.05–$742.96, anchored to the 20-day SMA and latest price.
Exit Target (Target Price): $777.59–$780.20, using the stated resistance and upper Bollinger Band.
Stop Loss protection: $665.75, at 20-day support.
For non-traders, the chart still favors the broader upward direction, but weakening momentum makes confirmation near resistance important before treating the advance as secure.
Summary Data META
Last price
742.96 USD
Change 1 day / 5 days / 1 month
3.38% / 0.14% / 11.62%
Trend / MA-cross
uptrend / none
SMA20 / SMA50
723.05 / 643.46
RSI (14) / Stochastic %K
62.0 / 45.9
Bollinger %B / ATR
67% / 22.46
Support / Resistance 20 days
665.75 / 777.59
Data as of
13 October 2026 03:00 WIB
Disclaimer: This technical analysis is generated automatically from exchange data (via Yahoo Finance) and indicators calculated by JournalArta, for information and education only. The verdict and the entry, target and stop-loss levels are not investment advice or a solicitation to buy or sell any security. Investment decisions and their risks rest solely with the reader.