Momentum Weakens, NVDA Stock Drops 1.29% on Monday
On October 12, 2026: price 226.32 USD, trend sideways, RSI 49.3, support 212.17, resistance 239.24. technical analysis of nvda stock. Momentum Weakens — full…
Why NVDA is in focus today
- MACD histogram has just turned negative
Selected automatically from 32 NASDAQ (US) stocks by a technical-signal score with daily weighted randomisation — not a recommendation.
Trend & Price Action
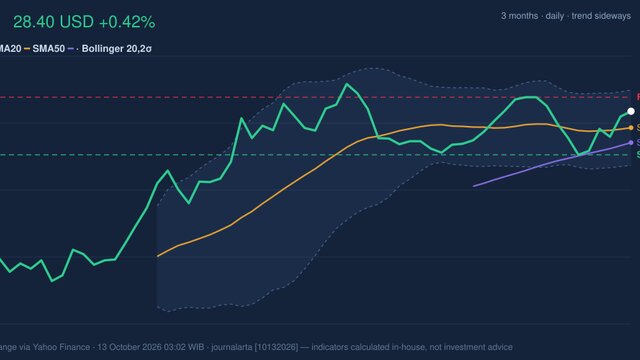
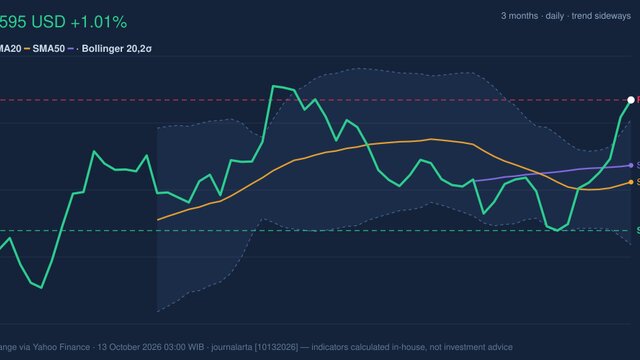
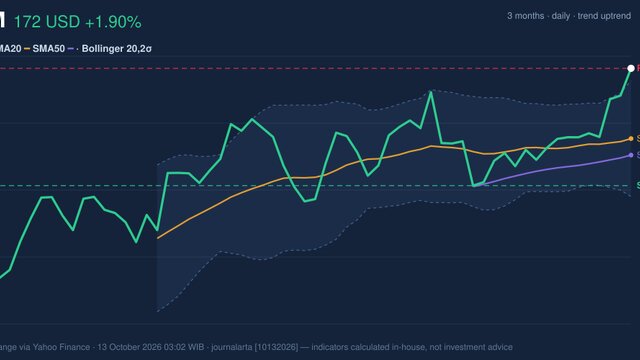
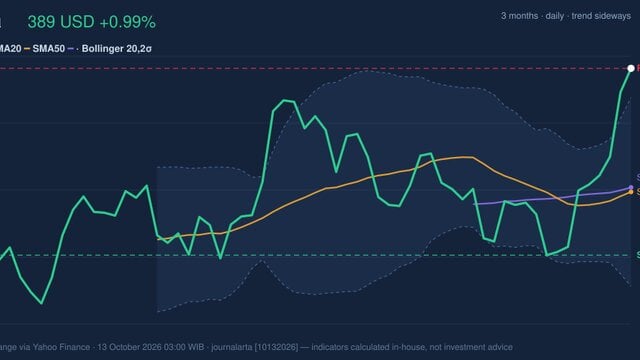
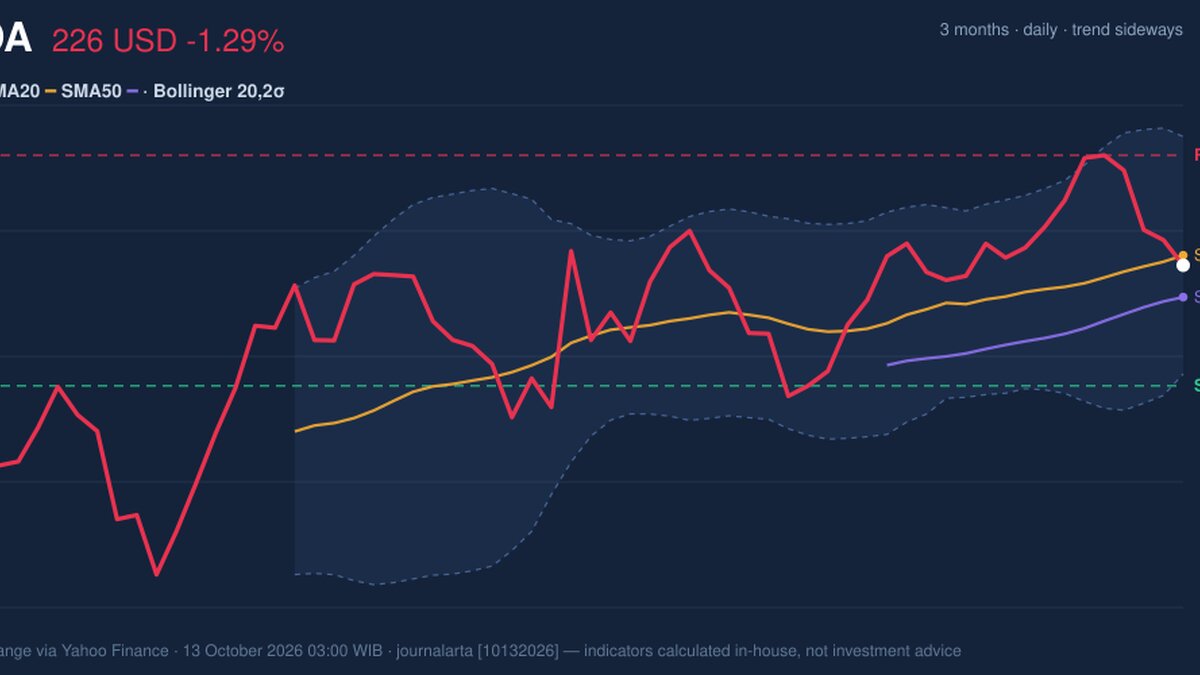
Nvidia closed below its 20-day simple moving average (SMA) of $227.50, but remained above its 50-day average of $222.59. That split points to near-term pressure without yet erasing the firmer price structure represented by the longer average. The 20-day average is still rising, up 1.47% over five days, and there has been no new moving-average crossover. In other words, the recent weakness has not yet produced a clear change in the trend signal. The stock sits at 52% of its 20-trading-day range, between support at $212.17 and resistance at $239.24. Its latest price is also near the Bollinger middle band at $227.50. Bollinger bands compare price with a recent average and show how widely prices have fluctuated; here, the 12.2% band width is described as normal, not unusually compressed or expanded. The 46% %B reading places the price slightly below the bands’ midpoint, consistent with a market that is soft but not at an extreme.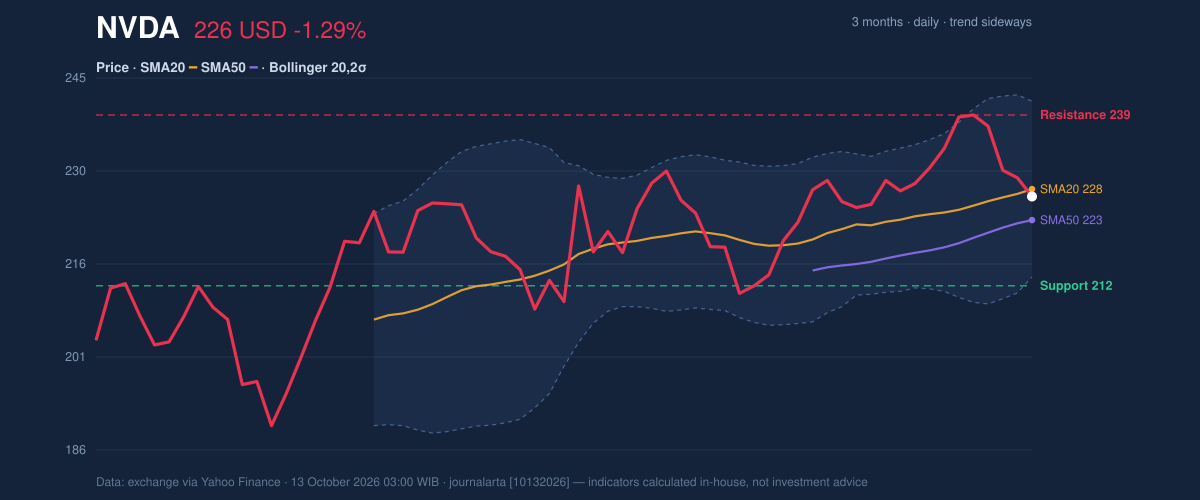
Oscillators & Momentum
The MACD histogram has turned negative at -0.436, with MACD at 3.278 below its 3.714 signal line. MACD compares shorter- and longer-term price momentum; when its line falls below the signal line, it suggests that upward momentum is fading. The new negative histogram is therefore the clearest short-term warning in the data, although it does not by itself establish a lasting reversal. Other momentum measures are less decisive. RSI is 49.3, neutral, indicating neither strong buying pressure nor an oversold market. Stochastic %K is 23.5 against %D at 34.1, also classified as neutral; the lower %K suggests recent prices have softened relative to their recent range, but the reading does not confirm a decisive breakdown. Together, these indicators describe weakening momentum within an unsettled, rather than strongly directional, market.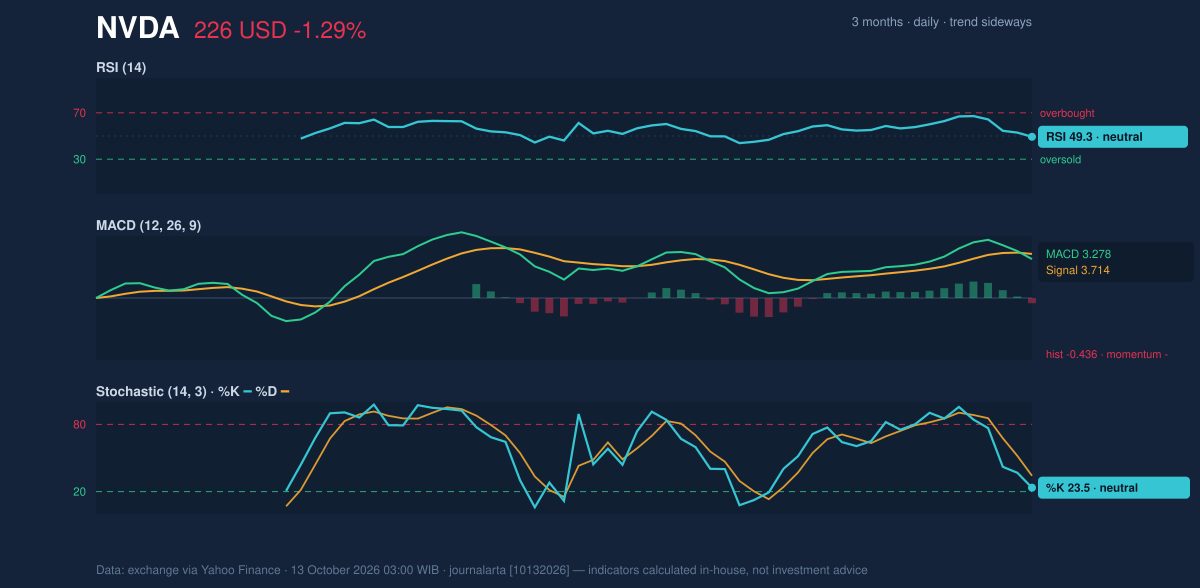
Volatility & Volume
Average true range (ATR), a measure of typical daily price movement, is $5.26, or 2.3% of the share price, pointing to moderate volatility. That matters because ordinary fluctuations can be meaningful near the moving-average and range boundaries, but the available data do not indicate an unusually volatile market. Trading volume was 70,089,000 shares, about 0.7 times the 20-day average of 105,751,405. The decline therefore came on lighter-than-usual participation, which makes it a weaker confirmation of broad selling pressure than a high-volume drop would be. On-balance volume (OBV), a running measure that adds volume on rising sessions and subtracts it on falling sessions, is rising. That divergence from the recent price softness suggests buying activity has not disappeared, though it does not cancel the MACD warning.Key Levels & Scenarios
The 20-day moving average at $227.50 is the nearby reference point: a move back above it would ease the immediate pressure, while continued trading below it would leave the negative MACD signal more prominent. A firmer test lies at resistance of $239.24; the three-month high is $243.37. On the downside, support at $212.17 is close to the lower Bollinger band at $213.57. A break below that support would weaken the range-bound interpretation; holding the area would preserve it. The three-month low is $190.01.Technical Verdict: HOLD (wait & see)
The indicators support a neutral technical reading rather than a clear directional signal. The price is below its rising SMA20 but above SMA50; the newly negative MACD histogram flags weakening momentum; and rising OBV, neutral RSI, and below-average volume temper the bearish evidence. The verdict is invalidated if price falls below $212.17, the 20-trading-day support.- Ideal Entry Range: $213.57–$222.59, bounded by the lower Bollinger band and SMA50.
- Exit Target: $239.24, the 20-trading-day resistance.
- Stop Loss: Below $212.17, the 20-trading-day support.
| Data point | Reading |
|---|---|
| Last price | $226.32 |
| Daily change | -1.29% |
| Five-day change | -5.27% |
| One-month change | +7.28% |
| Source and timestamp | Exchange data via Yahoo Finance, 13 October 2026, 03:00 WIB |
Summary Data NVDA
| Last price | 226.32 USD |
| Change 1 day / 5 days / 1 month | -1.29% / -5.27% / 7.28% |
| Trend / MA-cross | sideways / none |
| SMA20 / SMA50 | 227.50 / 222.59 |
| RSI (14) / Stochastic %K | 49.3 / 23.5 |
| Bollinger %B / ATR | 46% / 5.26 |
| Support / Resistance 20 days | 212.17 / 239.24 |
| Data as of | 13 October 2026 03:00 WIB |
Disclaimer: This technical analysis is generated automatically from exchange data (via Yahoo Finance) and indicators calculated by JournalArta, for information and education only. The verdict and the entry, target and stop-loss levels are not investment advice or a solicitation to buy or sell any security. Investment decisions and their risks rest solely with the reader.
Track NVDA stock price daily: live levels, support/resistance and our full NVDA analysis history.