BAT Stock Technicals: Gains 0.74% on Tuesday, Testing Key Resistance
On October 13, 2026: price 4,225.00 GBp, trend sideways, RSI 57.0, support 3,960.00, resistance 4,243.00. technical analysis of bat stock.
By Alistair Sterling
October 14, 20264 min read
BAT Stock Technicals
British American Tobacco rose 0.74% to 4,225.00 GBp on 13 October, extending its five-day gain to 5.65%, while trading near the top of its recent range. The shares are worth watching after JournalArta had not covered the stock in the previous 14 days, but thin reported volume and mixed momentum make the advance less conclusive than the price change alone suggests.
Trend & Price Action
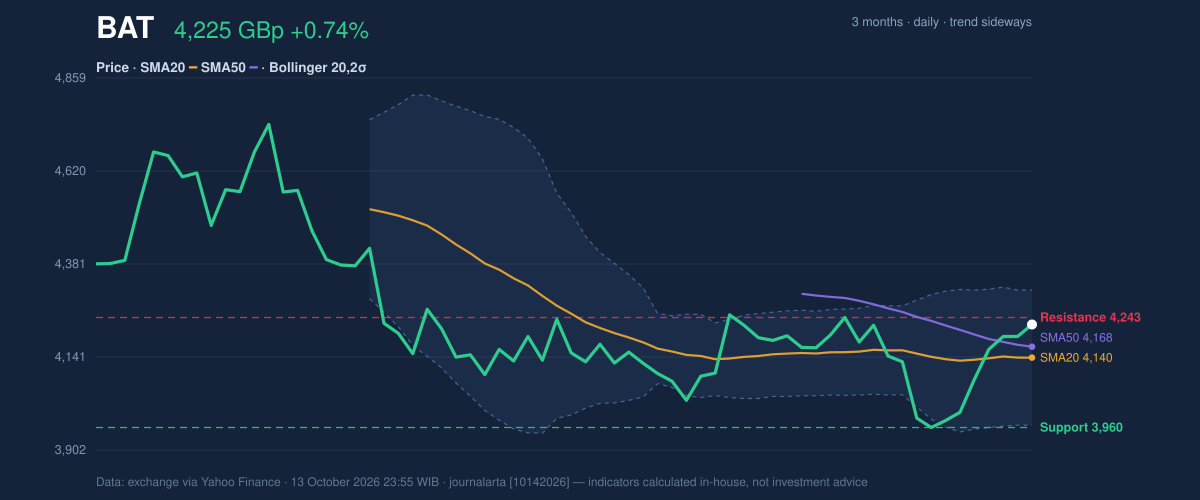
BAT’s trend is classified as sideways, despite the recent rise. Its price stands above the 20-day average of 4,139.90 and the 50-day average of 4,167.94, a constructive position, but there has been no fresh crossover between the averages to confirm a broader change in direction. The 20-day average is edging up, by 0.20% over five days, rather than signalling a decisive trend.
The stock is at 94% of its stated 20-day range, with resistance at 4,243.00 close overhead. That leaves limited room before a test of the level, while the 20-day support at 3,960.00 is substantially lower. The three-month high and low are listed as 5,368.00 and 0.00 respectively; the low is not a useful guide to a practical trading floor, so the nearer support and moving averages offer more relevant reference points.
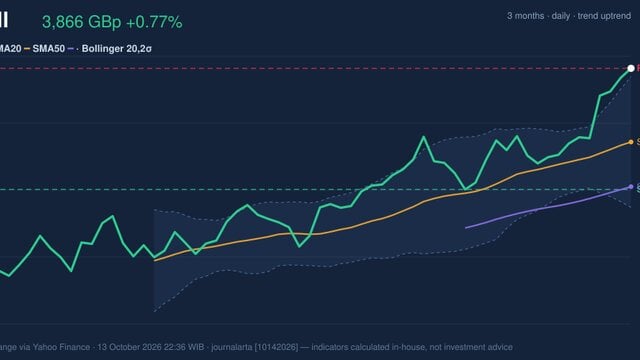
As shown in the chart, the price is above the Bollinger middle band, but below the upper band at 4,313.72. The 74% band position places it in the upper part of its recent volatility range, not yet at the boundary. The band width of 8.4% is described as normal, offering no clear squeeze signal that would point to an imminent burst of volatility.
3-month price action chart of BAT: price, SMA20/50, Bollinger, support & resistance. Data: exchange via Yahoo Finance.
Oscillators & Momentum
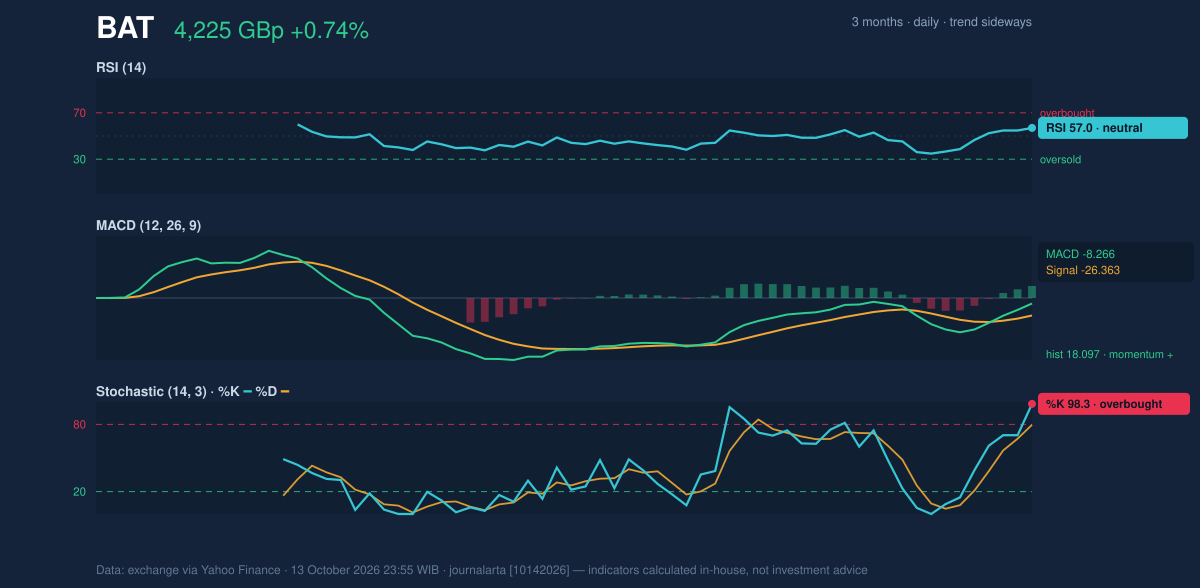
Momentum measures are positive but not fully aligned. The RSI is 57.0, a neutral reading, consistent with a share price that has strengthened without reaching a clearly stretched level. MACD is also improving: its histogram is positive at 18.097, while the MACD reading of -8.266 is above its signal line at -26.363. That configuration suggests upward momentum is building, although the MACD itself remains below zero, so it has not yet confirmed a strong longer-term upswing.
The caution comes from the Stochastic oscillator. Its %K of 98.3 and %D of 79.7 indicate overbought conditions—a sign that the latest advance may have moved quickly relative to the recent trading range. An overbought reading does not by itself establish that a reversal is under way, but it raises the risk of a pause, especially with resistance nearby.
Momentum chart of BAT: RSI(14), MACD, Stochastic. Data: exchange via Yahoo Finance.
Volatility & Volume
The ATR, a measure of typical price movement, is 381.92, or 9.0% of the share price. That is high volatility: a move that would look modest in a calmer stock can be ordinary for BAT by this measure, and price levels should not be treated as precise forecasts.
Trading participation is the clearest weakness in the session’s signal. Reported volume was 15,518 against a 20-day average of 3,587,781, effectively a thin-volume reading. OBV, which tracks whether volume tends to accompany rising or falling prices, is rising; that is supportive, but the extremely low latest volume makes it harder to judge how broadly the day’s gain was backed. The combination argues for caution in interpreting the rise as firm confirmation.
Key Levels & Scenarios
A sustained move above 4,243.00 resistance would strengthen the case that buyers can extend the advance; the upper Bollinger band at 4,313.72 is the next reference supplied by the data. If the price fails at resistance, the averages near 4,140–4,168 form an nearer area to monitor. A decline through 3,960.00 support would weaken the current technical picture and call into question the recent improvement.
Technical Verdict: HOLD (wait & see)
The indicators support a cautious, rather than decisive, reading: price is above both moving averages and MACD momentum is improving, but the sideways trend has no new moving-average crossover. Overbought Stochastic readings and unusually thin volume also reduce confidence in the latest rise. This verdict is invalidated if the price falls below 3,960.00.
Ideal entry range: 4,140–4,168 GBp, around the 20-day and 50-day averages, if price holds that area.
Exit target: 4,243–4,314 GBp, covering the stated resistance and upper Bollinger band.
Stop-loss protection: 3,960 GBp, the stated 20-day support.
For non-traders, HOLD means the chart has encouraging signs, but not enough confirmation yet to settle whether the rise can continue.
Summary Data BAT
Last price
4,225.00 GBp
Change 1 day / 5 days / 1 month
0.74% / 5.65% / 0.05%
Trend / MA-cross
sideways / none
SMA20 / SMA50
4,139.90 / 4,167.94
RSI (14) / Stochastic %K
57.0 / 98.3
Bollinger %B / ATR
74% / 381.92
Support / Resistance 20 days
3,960.00 / 4,243.00
Data as of
13 October 2026 23:55 WIB
Disclaimer: This technical analysis is generated automatically from exchange data (via Yahoo Finance) and indicators calculated by JournalArta, for information and education only. The verdict and the entry, target and stop-loss levels are not investment advice or a solicitation to buy or sell any security. Investment decisions and their risks rest solely with the reader.