RSI Overbought, BP Stock Gains 3.74% on Tuesday
On October 13, 2026: price 610.00 GBp, trend uptrend, RSI 72.5, support 542.30, resistance 610.00. technical analysis of bp stock. RSI Overbought — full…
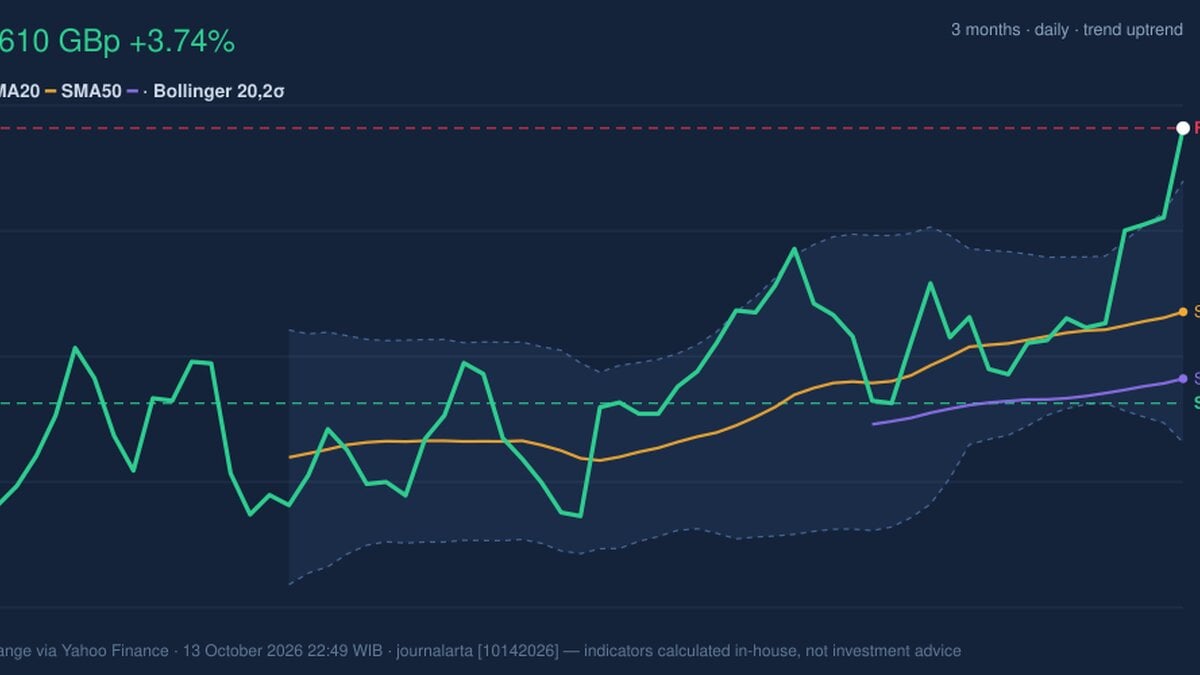
Why BP is in focus today
- Closed at a 20-day high (610.00)
- Trading near its 3-month high (610.00)
- RSI(14) at 72.5 — overbought zone
- Uptrend confirmed (5-day change 8.75%)
Selected automatically from 16 LSE (UK) stocks by a technical-signal score with daily weighted randomisation — not a recommendation.
Trend & Price Action
BP’s price is above both its 20-day simple moving average (SMA20), at 564.80 GBp, and its 50-day average, at 548.32 GBp. The SMA20 is rising, by 0.83% over five days, supporting the view that the short-term trend is upward. There has been no new moving-average crossover, however, so the latest signal comes from price strength rather than a fresh change in the longer trend. The shares have also moved above the upper Bollinger Band, now 597.01 GBp. Bollinger Bands track how far a price moves from its recent average; a close above the upper band can reflect unusually strong demand, but it can also mean the price has run ahead of its recent norm. The band width is 11.4%, described as normal, not a squeeze that might signal a coming burst of volatility. As shown in the chart, the central question is whether BP can hold above the former band ceiling and establish it as support.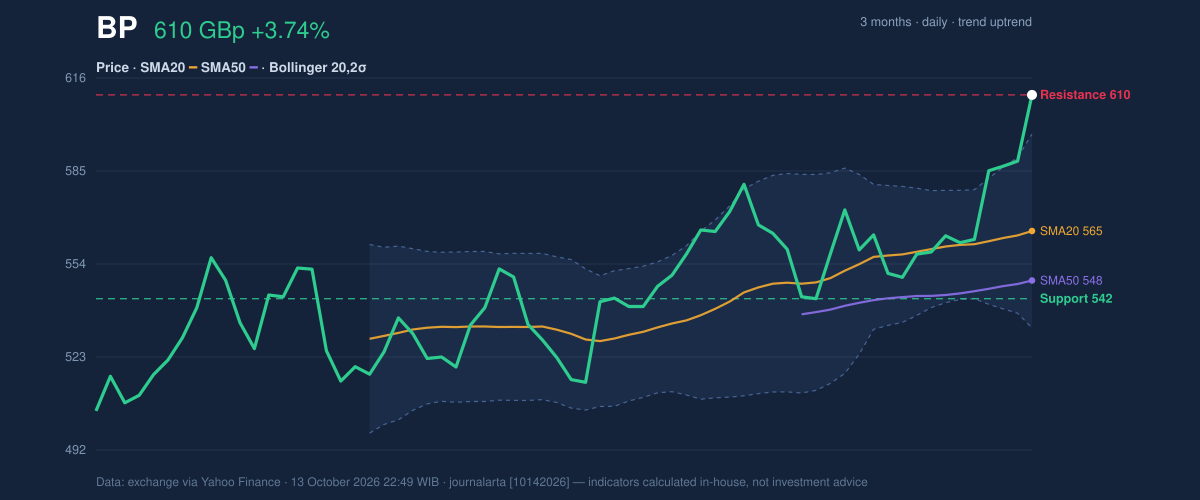
Oscillators & Momentum
Momentum indicators agree that the rally is forceful, but warn that it is crowded. The RSI is 72.5, above the commonly watched 70 threshold associated with overbought conditions. The Stochastic is also overbought, with %K at 100.0 and %D at 95.9. These readings do not, by themselves, predict a fall; they indicate that prices have risen quickly and may be more vulnerable to a pause or pullback. The MACD remains positive: its reading of 11.267 is above the 7.267 signal line, leaving a positive histogram of 4.000. That is evidence that upward momentum is still in place, even as the faster oscillators flag an extended move. The chart helps distinguish those messages: MACD confirms the direction, while RSI and Stochastic caution against assuming the advance can continue at the same pace.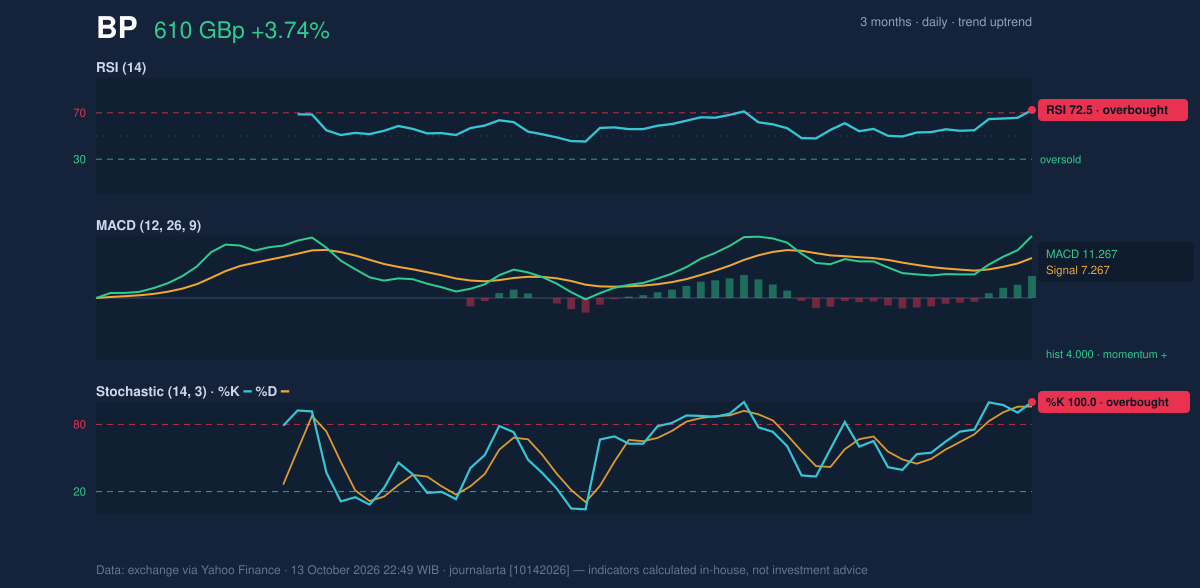
Volatility & Volume
The average true range, or ATR, is 57.73 GBp, equal to 9.5% of the last price. ATR estimates typical price movement rather than direction; at this level, normal swings are large enough to make the exact timing of a breakout difficult to read. It also means a pullback could be sharp without necessarily breaking the broader upward structure. Volume is a significant qualification. The latest reading of 72,204 is reported as thin against a 20-day average of 39,683,272, or 0.0 times that average at the displayed precision. On this data, the price advance lacks clear volume confirmation. OBV, a running measure of whether volume is accumulating on rising days or falling on declining days, is rising, offering a positive counter-signal—but thin turnover makes that support less persuasive. The technical picture is bullish in direction but weakened by overbought momentum and exceptionally thin reported volume.Technical Verdict: HOLD (wait & see)
The verdict reflects three signals: price is above rising short- and medium-term averages; MACD is positive; but RSI and Stochastic are overbought, with the latest price at the 20-day resistance and above the upper Bollinger Band. The reading would be invalidated if BP falls below 542.30 GBp, the stated 20-day support. - Ideal entry range: 564.80–597.01 GBp, bounded by the SMA20 and upper Bollinger Band; this is a technical reference range, not a forecast. - Exit target: 610.00 GBp, the reported 20-day resistance and current range high. - Stop-loss protection: 542.30 GBp, the reported 20-day support. In plain English, BP’s trend points upward, but the rally needs firmer confirmation before its strength can be treated as durable.Summary Data BP
| Last price | 610.00 GBp |
| Change 1 day / 5 days / 1 month | 3.74% / 8.75% / 5.12% |
| Trend / MA-cross | uptrend / none |
| SMA20 / SMA50 | 564.80 / 548.32 |
| RSI (14) / Stochastic %K | 72.5 / 100.0 |
| Bollinger %B / ATR | 120% / 57.73 |
| Support / Resistance 20 days | 542.30 / 610.00 |
| Data as of | 13 October 2026 22:49 WIB |
Disclaimer: This technical analysis is generated automatically from exchange data (via Yahoo Finance) and indicators calculated by JournalArta, for information and education only. The verdict and the entry, target and stop-loss levels are not investment advice or a solicitation to buy or sell any security. Investment decisions and their risks rest solely with the reader.
Track BP share price daily: live levels, support/resistance and our full BP analysis history.