AMAT Stock Drops 3.79%, Golden Cross Formed In Focus
On October 14, 2026: price 446.63 USD, trend sideways, RSI 36.1, support 417.40, resistance 542.28. technical analysis of amat stock. AMAT Stock Drops — full…
Why AMAT is in focus today
- Fresh golden cross: SMA20 crossed above SMA50
Selected automatically from 32 NASDAQ (US) stocks by a technical-signal score with daily weighted randomisation — not a recommendation.
Trend & Price Action
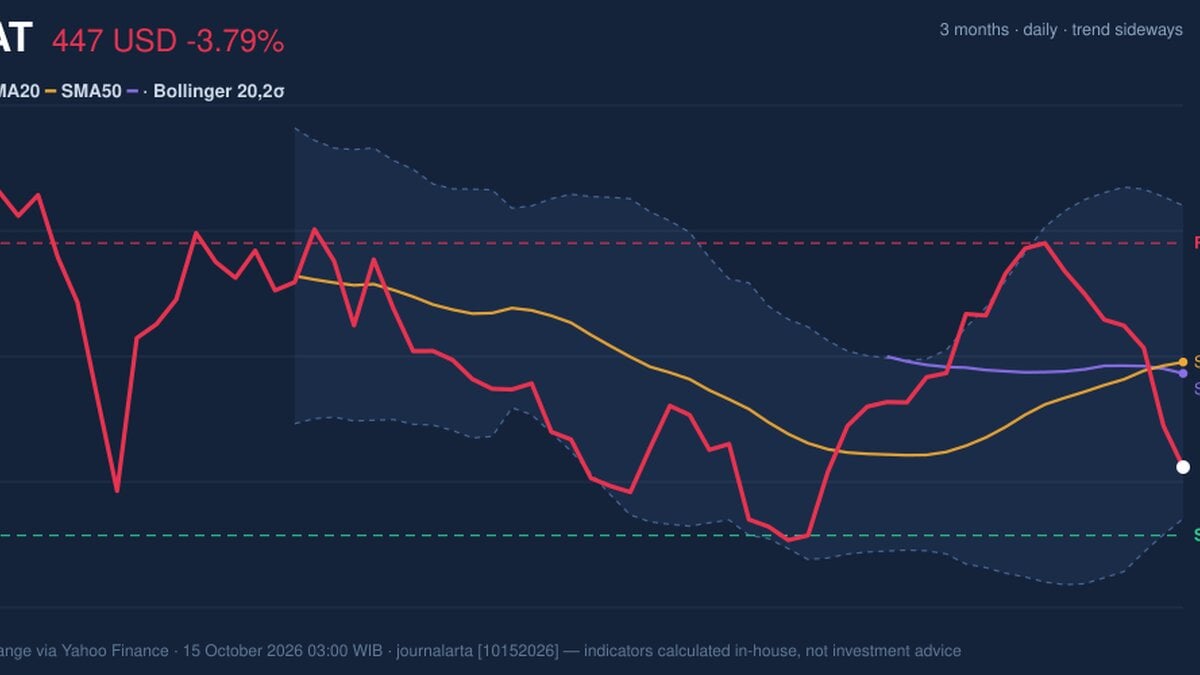
The stock closed below both its SMA20 of $491.50 and SMA50 of $486.66. A golden cross—when the shorter-term average moves above the longer-term average—can indicate that a trend is improving, but it is not a guarantee of further gains. Here, the crossover is fresh, the broader trend is classified as sideways, and the latest price is well beneath both averages. The five-day loss of 14.22% contrasts with a 7.52% gain over one month. That divergence suggests a recent reversal in momentum rather than a uniformly weak month. The price sits near the lower end of its 20-trading-day range: support is $417.40 and resistance is $542.28, with the shares positioned 23% of the way up that range. The three-month low of $411.51 is close to the stated support, making that area an important test. As shown in the chart, the price is below the Bollinger middle line at $491.50 and nearer the lower band at $424.65. Bollinger bands measure how far a price is moving around its recent average; a widening band indicates that volatility is increasing. The 27.2% band width and ATR of $19.09—about 4.3% of the share price—point to unusually large potential daily swings, not to a settled floor.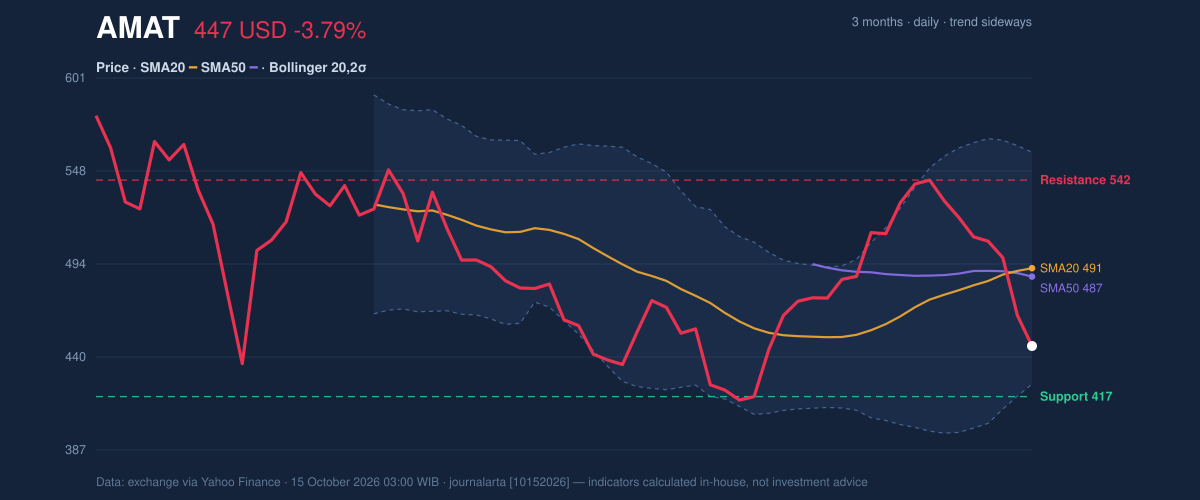
Oscillators & Momentum
The momentum readings reinforce the near-term weakness, though they also suggest the sell-off may be stretched. RSI is 36.1, a subdued reading that remains above the commonly used oversold threshold. The Stochastic indicator is more extreme: %K at 1.1 and %D at 18.6 are in oversold territory. Such readings describe the pace of recent declines; they do not, by themselves, confirm that a rebound has begun. The MACD gives the clearest bearish confirmation. Its histogram is negative at -5.470, with the MACD at 2.160 below its 7.630 signal line. This indicates that downward momentum is stronger than the recent trend measured by the indicator. A turn higher in the histogram could show that selling pressure is easing, but no such confirmation is present in the supplied data.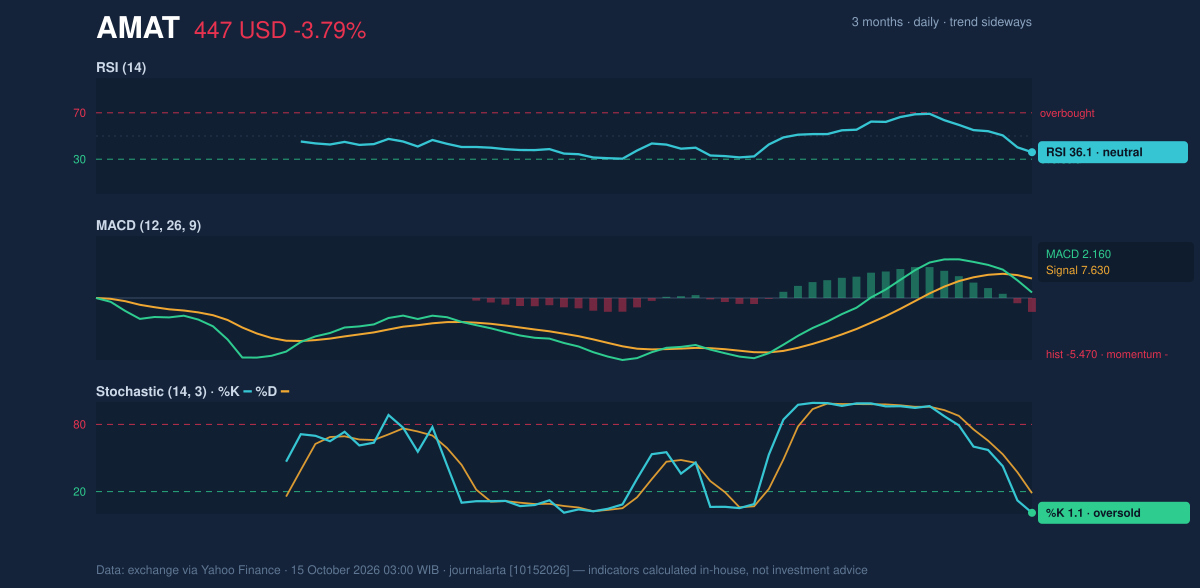
Volatility, Volume & Key Levels
Trading volume reached 8,478,200 shares, about 1.3 times its 20-day average. The larger turnover gives the decline more weight than a drop on thin trading would have. On-balance volume, a measure that tracks whether trading volume is accumulating on up days or down days, is also falling, consistent with selling pressure rather than broad accumulation. The first nearby test is support at $417.40, close to the three-month low of $411.51 and the lower Bollinger band at $424.65. A break below support would weaken the case that the golden cross can underpin a recovery. If that area holds, the first substantial technical hurdle is the cluster around the SMA50 at $486.66 and SMA20 at $491.50. Resistance at $542.28 is a more distant ceiling, not a signal that the price is already approaching it.Technical Verdict: HOLD (wait & see)
The technical balance favors caution rather than a directional call. The golden cross and rising SMA20 slope are constructive, but the share price is below both moving averages. Meanwhile, negative MACD momentum, falling OBV and above-average volume during the decline point to persistent near-term selling. Oversold Stochastic readings raise the possibility of a bounce, but do not yet establish a reversal. - Ideal entry range: $424.65–$446.63, around the lower Bollinger band and latest price; this range depends on support holding. - Exit target: $486.66–$491.50, the SMA50–SMA20 resistance cluster. - Stop-loss protection: below $417.40, the stated 20-trading-day support. - Invalidation condition: the verdict is invalidated if price breaks below $417.40. For non-traders, the shares show a possible longer-term improvement but have not yet demonstrated that the latest sell-off has ended. | Indicator | Reading | |---|---:| | Last price | $446.63 | | One-day change | -3.79% | | Five-day change | -14.22% | | One-month change | +7.52% | | SMA20 / SMA50 | $491.50 / $486.66 | | Golden cross | SMA20 above SMA50 | | Bollinger bands | $424.65 / $491.50 / $558.35 | | RSI / Stochastic | 36.1 / oversold | | MACD histogram | -5.470 | | Volume / 20-day average | 8,478,200 / 6,453,935 | | Support / resistance | $417.40 / $542.28 | The data, attributed to exchange information via Yahoo Finance, are dated October 15, 2026, 03:00 WIB.Summary Data AMAT
| Last price | 446.63 USD |
| Change 1 day / 5 days / 1 month | -3.79% / -14.22% / 7.52% |
| Trend / MA-cross | sideways / golden |
| SMA20 / SMA50 | 491.50 / 486.66 |
| RSI (14) / Stochastic %K | 36.1 / 1.1 |
| Bollinger %B / ATR | 16% / 19.09 |
| Support / Resistance 20 days | 417.40 / 542.28 |
| Data as of | 15 October 2026 03:00 WIB |
Disclaimer: This technical analysis is generated automatically from exchange data (via Yahoo Finance) and indicators calculated by JournalArta, for information and education only. The verdict and the entry, target and stop-loss levels are not investment advice or a solicitation to buy or sell any security. Investment decisions and their risks rest solely with the reader.
Track AMAT stock price daily: live levels, support/resistance and our full AMAT analysis history.