COIN Stock Drops 4.90% on Wednesday, Testing Support Level
On October 14, 2026: price 172.89 USD, trend sideways, RSI 43.8, support 172.00, resistance 201.07. technical analysis of coin stock. COIN Stock Drops — full…
By matthew jonathan
October 15, 20264 min read
COIN Stock Drops 4.90% on Wednesday, Testing Support Level
Coinbase traded at $172.89 on Nasdaq on Oct. 15, down 4.90% from its previous close, with the cryptocurrency exchange’s shares near the bottom of their recent trading range. The stock has not been covered by JournalArta in the past 14 days. That makes the sharp daily decline notable, but the technical picture is mixed: short-term momentum is weak while a stochastic reading signals an oversold market.
Trend & Price Action
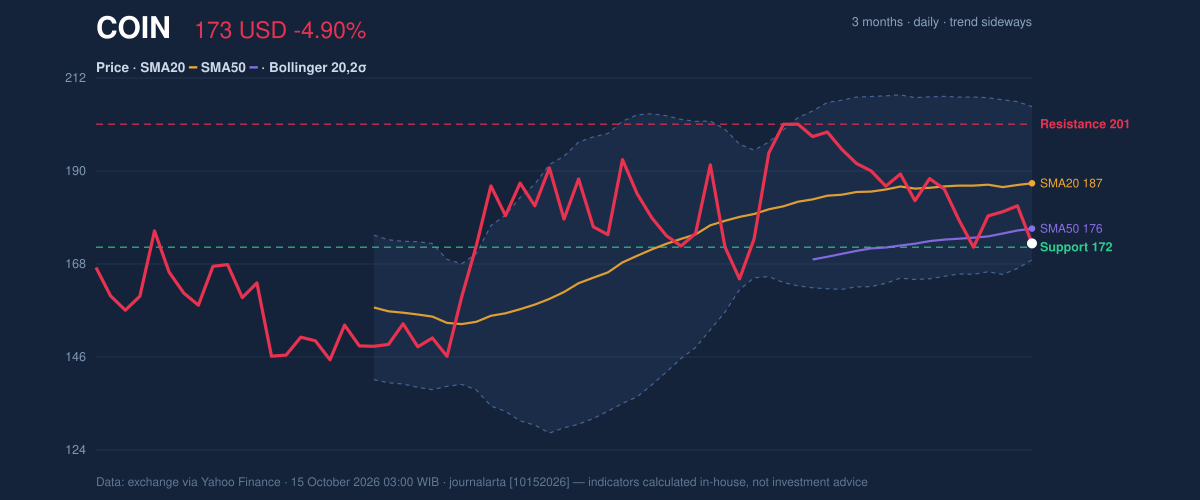
Coinbase fell below both its 20-day simple moving average (SMA) of $187.11 and its 50-day SMA of $176.40. A simple moving average tracks the average closing price over a set period; trading below both suggests sellers have the upper hand in the near term. There is no new moving-average crossover, so the data do not show a fresh long-term trend signal.
The broader trend is sideways, and the 20-day average has edged up 0.29% over five trading days. That slight rise offers limited support for the price structure, but it has not prevented the latest decline. Coinbase is just above $172.00 support, a level based on the past 20 trading days, and sits in the lowest 3% of that period’s range. As shown in the chart, the proximity to support makes the next price move more informative than the recent average slope.
3-month price action chart of COIN: price, SMA20/50, Bollinger, support & resistance. Data: exchange via Yahoo Finance.
Over the past month, the stock is up 5.09%, despite a 3.12% decline over five days. The contrast points to a recent pullback within a stronger one-month result rather than a uniformly falling price. Over three months, Coinbase has traded between $139.11 and $208.33, leaving its current price well above the period low but far from its high.
Oscillators & Momentum
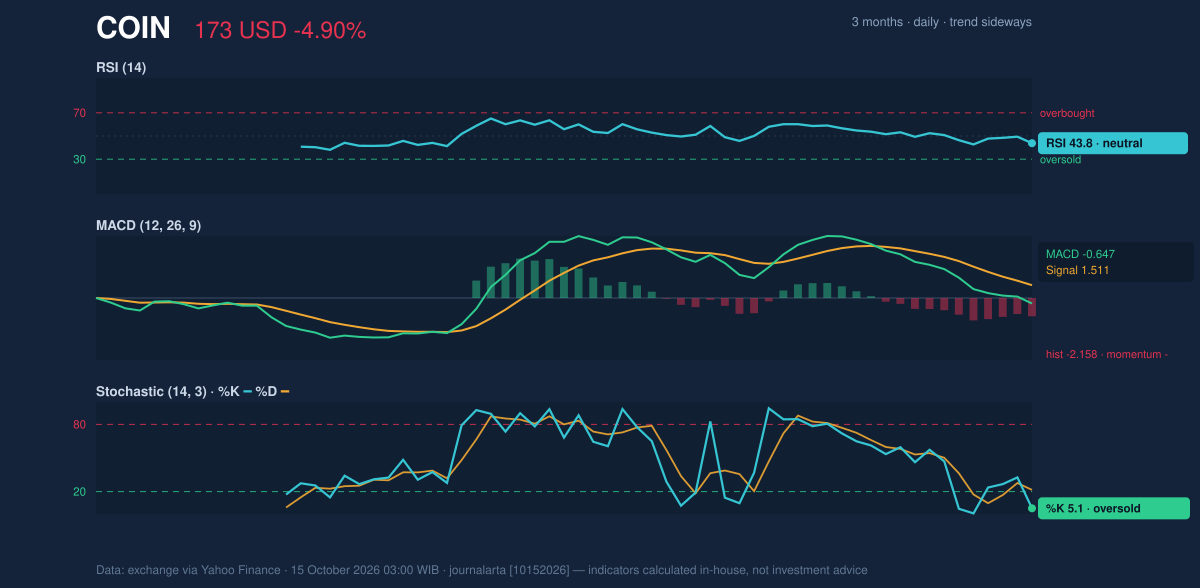
The indicators do not yet confirm a rebound. The RSI is neutral at 43.8; the Relative Strength Index measures the pace of recent gains and losses, and this reading is below the midpoint rather than showing strong buying momentum. The Stochastic is oversold, with %K at 5.1 and %D at 21.5. That can signal that selling has been intense, but an oversold reading alone does not establish that a price decline has ended.
The MACD, a tool for comparing short- and longer-term price momentum, remains negative: its reading is -0.647, below the signal line at 1.511, with a -2.158 histogram. Negative MACD momentum and falling OBV—a measure that relates trading volume to price direction—suggest the pullback has not yet been accompanied by a clear shift toward accumulation.
Momentum chart of COIN: RSI(14), MACD, Stochastic. Data: exchange via Yahoo Finance.
Volatility, Volume & Key Levels
Coinbase’s price is near the lower Bollinger Band at $169.00, with a %B reading of 11%. Bollinger Bands plot a range around a moving average; a low %B places the price near the lower edge, reflecting downward pressure, though not a guaranteed reversal. The band width of 19.4% is described as normal, so the data do not indicate an unusually tight squeeze that might foreshadow a sharp breakout.
Volatility is elevated: the Average True Range, or ATR, is $9.46, equivalent to 5.5% of the share price. The latest volume of 6,957,300 shares was 0.8 times the 20-day average of 8,957,590. The lower-than-average turnover means the decline came without heavier-than-usual trading participation, while falling OBV remains a cautionary sign.
The immediate test is $172.00 support. A sustained move below it would weaken the price structure and leave the lower Bollinger Band at $169.00 as the next reference in the supplied data. If support holds, a recovery would first need to contend with the $176.40 50-day SMA and then the $187.11 20-day SMA. The 20-day resistance level is $201.07; that remains distant unless the shares regain those moving averages.
Technical Verdict: HOLD
HOLD (wait & see) fits the conflicting signals: the price is below both moving averages, MACD is negative and OBV is falling, but the stochastic is oversold and the shares are close to support. The verdict is invalidated if the price falls below $172.00.
Ideal Entry Range: $169.00–$172.00, around the lower Bollinger Band and 20-day support.
Exit Target (Target Price): $187.11, the 20-day SMA; the next reference above it is $201.07 resistance.
Stop Loss: Below $169.00, using the lower Bollinger Band as the stated technical boundary.
In plain English, the chart shows a weak short-term trend but also a price near support and an oversold stochastic reading.
Metric
Reading
Last price
$172.89
Daily change
-4.90%
20-day / 50-day SMA
$187.11 / $176.40
20-day support / resistance
$172.00 / $201.07
RSI / Stochastic
43.8 / %K 5.1, %D 21.5
MACD / signal / histogram
-0.647 / 1.511 / -2.158
Summary Data COIN
Last price
172.89 USD
Change 1 day / 5 days / 1 month
-4.90% / -3.12% / 5.09%
Trend / MA-cross
sideways / none
SMA20 / SMA50
187.11 / 176.40
RSI (14) / Stochastic %K
43.8 / 5.1
Bollinger %B / ATR
11% / 9.46
Support / Resistance 20 days
172.00 / 201.07
Data as of
15 October 2026 03:00 WIB
Disclaimer: This technical analysis is generated automatically from exchange data (via Yahoo Finance) and indicators calculated by JournalArta, for information and education only. The verdict and the entry, target and stop-loss levels are not investment advice or a solicitation to buy or sell any security. Investment decisions and their risks rest solely with the reader.