On October 14, 2026: price 1,839.11 USD, trend sideways, RSI 50.4, support 1,685.12, resistance 1,892.44. technical analysis of meli stock.
By matthew jonathan
October 15, 20264 min read
MELI Momentum Gains
MercadoLibre’s shares fell 1.97% to $1,839.11 in the latest session, leaving the Latin American e-commerce and payments company between a rising-volume signal in its on-balance volume and a thin trading session. That combination matters: the stock’s recent weakness has not been matched by a clear break in its broader sideways pattern, but low turnover offers limited confirmation of a rebound.
The shares were down 1.80% over five trading days and nearly unchanged over a month, according to market data from Yahoo Finance as of October 15, 2026. They remain above the 20-day moving average, a measure of the average closing price over that period, but below the 50-day average. The short-term average is edging lower, while no new crossover between the two averages has formed.
The price structure is unresolved.
Trend & Price Action
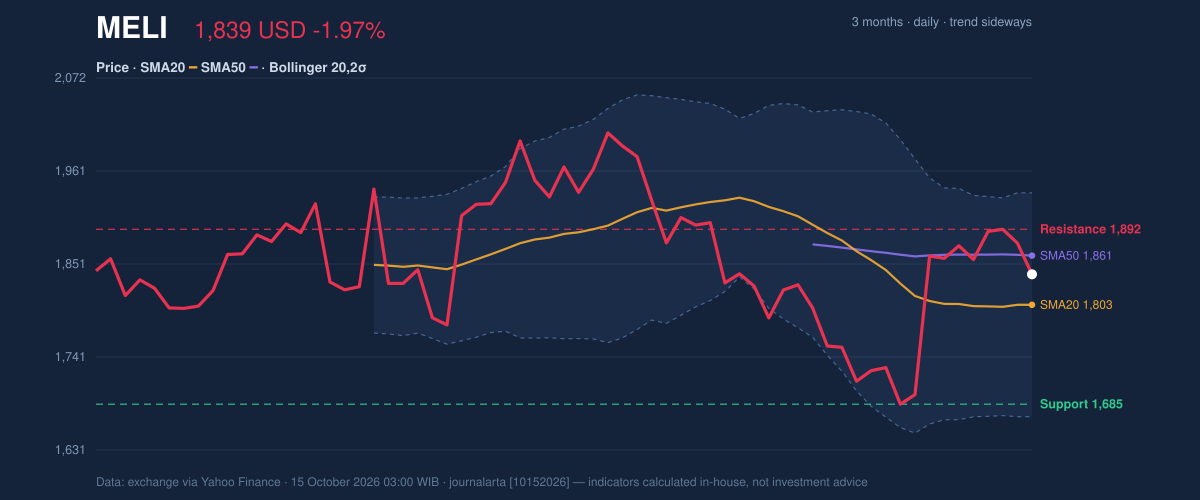
At $1,839.11, MercadoLibre sits between its $1,802.93 20-day average and $1,861.21 50-day average. Holding above the shorter average suggests recent selling has not erased all near-term support; staying below the longer one shows the stock has yet to regain a broader measure of trend strength. With the 20-day average slipping 0.05% over five days and no new moving-average crossover, the data point to consolidation rather than a confirmed change of direction.
The shares are at 74% of their 20-trading-day range, closer to its resistance than its support. The range runs from $1,685.12 support to $1,892.44 resistance. A move above resistance would put the recent ceiling under pressure; failure to hold the 20-day average would leave the lower end of the range more relevant. Over three months, the stock has traded between $1,668.44 and $2,066.00.
As shown in the chart, price remains inside the Bollinger bands, which frame typical volatility around a moving average.
3-month price action chart of MELI: price, SMA20/50, Bollinger, support & resistance. Data: exchange via Yahoo Finance.
The bands are at $1,670.35 and $1,935.51, with the middle line at $1,802.93. The reading at 64% of the band’s width places the stock above the midpoint but not near the upper boundary. Bollinger width is normal at 14.7%, not signaling a volatility squeeze—a period of unusually narrow trading that can precede a larger move. The bands therefore show room for movement in either direction, not a breakout signal.
Oscillators & Momentum
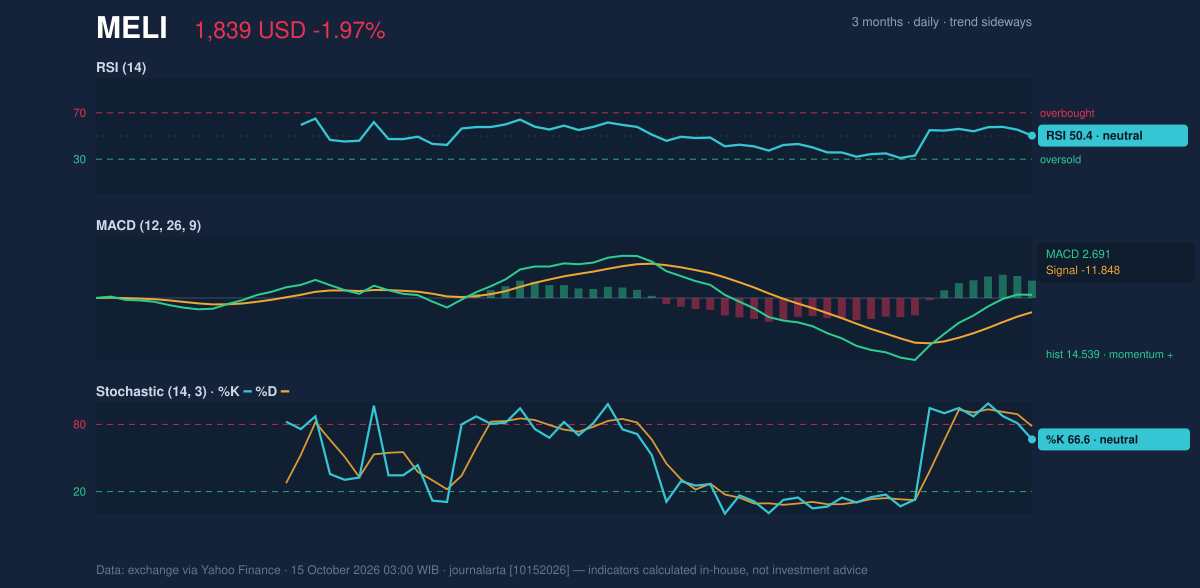
Momentum indicators are mixed but not extreme. The RSI is neutral at 50.4; the Relative Strength Index gauges the pace of recent gains and losses, with this reading showing neither strong buying pressure nor an oversold condition. The Stochastic is also neutral, with %K at 66.6 and %D at 78.4. Its faster line below the slower one suggests some cooling in short-term momentum, without establishing a decisive reversal.
MACD, a trend-following momentum measure, is more constructive: MACD is 2.691, above its -11.848 signal line, with a positive 14.539 histogram. The histogram measures the gap between the two lines, so its positive reading indicates improving momentum. That improvement has not yet translated into a sustained price advance above the 50-day average.
The chart makes the contrast visible: positive MACD readings sit alongside neutral RSI and Stochastic measures.
Momentum chart of MELI: RSI(14), MACD, Stochastic. Data: exchange via Yahoo Finance.
Volatility & Volume
Average True Range, which estimates the typical daily trading span, is $54.37, or 3.0% of the share price. That points to moderate volatility: daily swings remain meaningful, but the indicator does not describe an unusually turbulent market.
Volume was 379,900 shares, about 0.6 times the 20-day average of 646,990—classified as thin. On-balance volume, which tracks whether trading volume is flowing more on rising or falling sessions, is rising. That is a supportive sign, but the light latest turnover means the price decline has not been tested by average participation. Rising OBV is constructive; thin volume makes it a tentative signal.
Technical Verdict: HOLD (wait & see)
The indicators favor a neutral stance: the stock is above its 20-day average and MACD momentum is positive, but it remains below the 50-day average, while RSI and Stochastic are neutral. Low volume also weakens confirmation. The verdict would be invalidated if price falls below $1,685.12, the 20-day support level.
- Ideal entry range: $1,802.93–$1,861.21, bounded by the 20-day and 50-day averages.
- Exit target: $1,892.44, the 20-day resistance.
- Stop-loss protection: $1,670.35, the lower Bollinger band.
In plain English, the chart is caught between improving momentum and a ceiling that the share price has not yet cleared.
Indicator
Reading
Last price
$1,839.11
Daily change
-1.97%
20-day / 50-day average
$1,802.93 / $1,861.21
RSI / Stochastic
50.4 / 66.6 (%K), 78.4 (%D)
MACD / signal / histogram
2.691 / -11.848 / 14.539
20-day support / resistance
$1,685.12 / $1,892.44
Volume / 20-day average
379,900 / 646,990
Summary Data MELI
Last price
1,839.11 USD
Change 1 day / 5 days / 1 month
-1.97% / -1.80% / -0.03%
Trend / MA-cross
sideways / none
SMA20 / SMA50
1,802.93 / 1,861.21
RSI (14) / Stochastic %K
50.4 / 66.6
Bollinger %B / ATR
64% / 54.37
Support / Resistance 20 days
1,685.12 / 1,892.44
Data as of
15 October 2026 03:00 WIB
Disclaimer: This technical analysis is generated automatically from exchange data (via Yahoo Finance) and indicators calculated by JournalArta, for information and education only. The verdict and the entry, target and stop-loss levels are not investment advice or a solicitation to buy or sell any security. Investment decisions and their risks rest solely with the reader.