Momentum Gains, CSCO Stock Drops 1.24% on Wednesday
On October 14, 2026: price 113.64 USD, trend sideways, RSI 53.3, support 106.43, resistance 118.39. technical analysis of csco stock. Momentum Gains — full…
By matthew jonathan
October 15, 20264 min read
Momentum Gains, CSCO Stock Drops 1.24% on Wednesday
Cisco shares fell 1.24% to $113.64 on Nasdaq, extending a five-day decline of 3.19% even as the stock remained higher over the past month. The pullback leaves the shares above their 20-day moving average, while MACD remains positive; together, those signals point to short-term pressure within a still broadly sideways trading pattern, rather than a clear break in trend.
Trend & Price Action
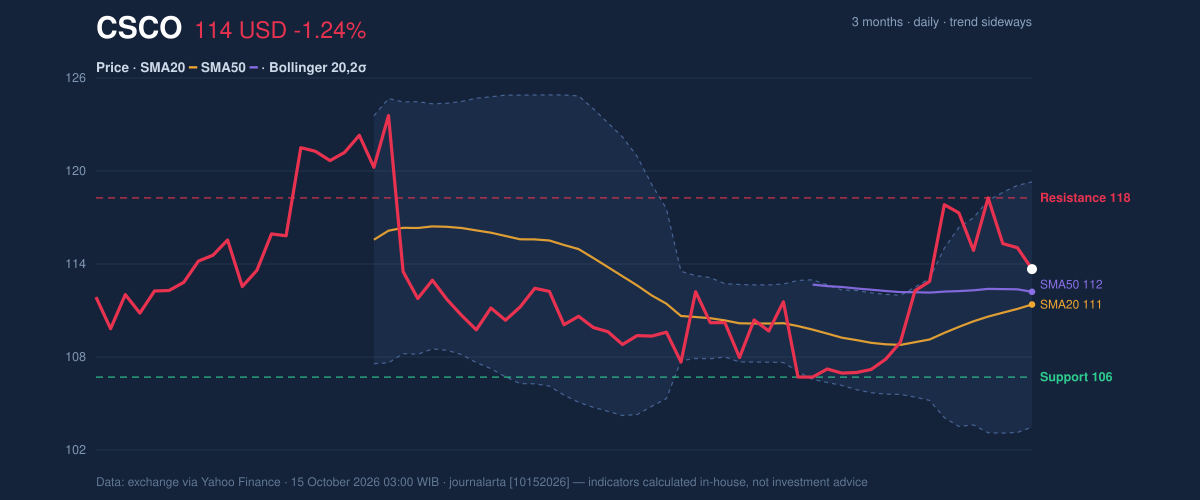
Cisco’s last price is above its 20-day simple moving average (SMA) of $111.27, a level that tracks the average closing price over the past 20 trading days. But it is only slightly above the 50-day SMA of $112.13? No: at $113.64, the share price is above both averages, though the 50-day average itself is higher than the 20-day one. That ordering, alongside the absence of a recent moving-average crossover, offers no clear signal that the longer-term trend has turned decisively upward.
The 20-day average has a rising slope of 1.36% over five trading days, suggesting recent underlying support despite the latest declines. The stock sits about 60% of the way through its $106.43–$118.39 20-day range, closer to resistance than support. Over three months, shares have traded between $104.51 and $124.71, putting the current price inside a wider range rather than near either extreme.
As shown in the chart, the Bollinger Bands—bands that widen or narrow with price volatility—span $103.09 to $119.46, with the middle line at $111.27. Cisco’s 64% position within the bands places it above the midpoint but not near the upper edge. The 14.7% band width is described as normal, so the setup does not point to an unusually compressed market poised for a sharp move.
3-month price action chart of CSCO: price, SMA20/50, Bollinger, support & resistance. Data: exchange via Yahoo Finance.
Oscillators & Momentum
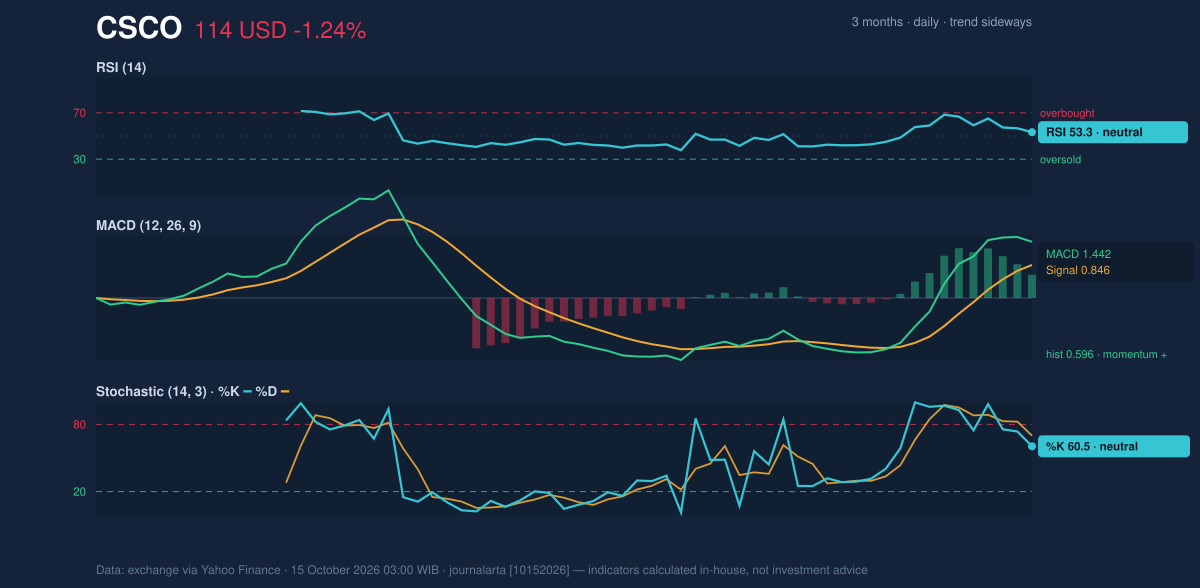
Momentum readings are mixed but not strongly bearish. The RSI is 53.3, a neutral reading: the Relative Strength Index measures the pace of recent gains and losses, and this level suggests neither stretched buying nor pronounced selling. The Stochastic reading is also neutral, with %K at 60.5 and %D at 69.9. Because %K is below %D, the indicator shows some near-term cooling, though not an extreme signal on its own.
MACD provides the stronger counterpoint to the recent price decline. Its value of 1.442 is above the 0.846 signal line, and the histogram is positive at 0.596. That positive MACD configuration indicates upward momentum remains in the calculation, even as the share price has weakened over five days. It is evidence of resilience, not proof that the pullback has ended.
As shown in the momentum chart, the indicators do not yet align behind a single direction: MACD is positive, while RSI and Stochastic remain neutral.
Momentum chart of CSCO: RSI(14), MACD, Stochastic. Data: exchange via Yahoo Finance.
Volatility, Volume & Key Levels
Average True Range, a measure of typical price movement, is $2.70, or 2.4% of the share price—consistent with moderate volatility. That makes the recent decline notable but not, by itself, evidence of an unusually large market shock.
Trading volume was 16.7 million shares, compared with a 20-day average of 19.2 million, or about 0.9 times normal. The below-average activity suggests the drop came without a surge in participation. Meanwhile, rising On-Balance Volume (OBV), which combines price direction with trading volume, indicates cumulative volume has been supportive. That divergence tempers the bearish reading of the recent price action.
The nearest reference points are support at $106.43 and resistance at $118.39. A sustained move above resistance would strengthen the case that the stock is advancing within its broader range; a failure to hold support would weaken the current structure and bring the lower Bollinger Band at $103.09 into view. The upper band at $119.46 is another nearby ceiling to monitor if shares approach resistance.
Technical Verdict: HOLD (wait & see)
The technical picture is balanced: shares remain above both moving averages and MACD is positive, but the five-day decline and neutral oscillators do not confirm a fresh directional move. The rising OBV and relatively light volume on the pullback offer support, while the lack of a recent moving-average crossover limits conviction.
- Ideal entry range: $111.27–$112.13, around the 20- and 50-day moving averages.
- Exit target (target price): $118.39, the 20-day resistance level.
- Stop-loss protection: $106.43, the 20-day support level.
- Invalidation condition: The verdict is invalidated if the price falls below $106.43.
In plain English, the indicators favor waiting for price to clarify whether support holds or resistance gives way.
Metric
Reading
Last price
$113.64
SMA20 / SMA50
$111.27 / $112.13
RSI / Stochastic
53.3 / 60.5 and 69.9
MACD / signal / histogram
1.442 / 0.846 / 0.596
Support / resistance
$106.43 / $118.39
Source
Nasdaq market data via Yahoo Finance, as of Oct. 15, 2026, 03:00 WIB
Summary Data CSCO
Last price
113.64 USD
Change 1 day / 5 days / 1 month
-1.24% / -3.19% / 5.48%
Trend / MA-cross
sideways / none
SMA20 / SMA50
111.27 / 112.13
RSI (14) / Stochastic %K
53.3 / 60.5
Bollinger %B / ATR
64% / 2.70
Support / Resistance 20 days
106.43 / 118.39
Data as of
15 October 2026 03:00 WIB
Disclaimer: This technical analysis is generated automatically from exchange data (via Yahoo Finance) and indicators calculated by JournalArta, for information and education only. The verdict and the entry, target and stop-loss levels are not investment advice or a solicitation to buy or sell any security. Investment decisions and their risks rest solely with the reader.