On October 14, 2026: price 375.04 USD, trend sideways, RSI 45.9, support 363.58, resistance 419.91. technical analysis of panw stock. PANW Stock Analysis —…
By matthew jonathan
October 15, 20264 min read
PANW Stock Analysis
Yahoo Finance market data showed Palo Alto Networks shares down 5.54% to $375.04 in the latest session, with trading volume above its 20-day average and the On-Balance Volume (OBV) indicator falling. The stock has not been covered by JournalArta in the past 14 days, making the sharp move a fresh point of focus. The decline was decisive.
PANW also fell 7.53% over five trading days, while its one-month change was a smaller decline of 0.16%. That contrast suggests the latest weakness is concentrated in the shorter-term trend rather than reflecting an equally steep monthly slide. But the price is now below its 20-day moving average, a measure of the average closing price over that period, while still slightly above its 50-day average.
Trend & Price Action
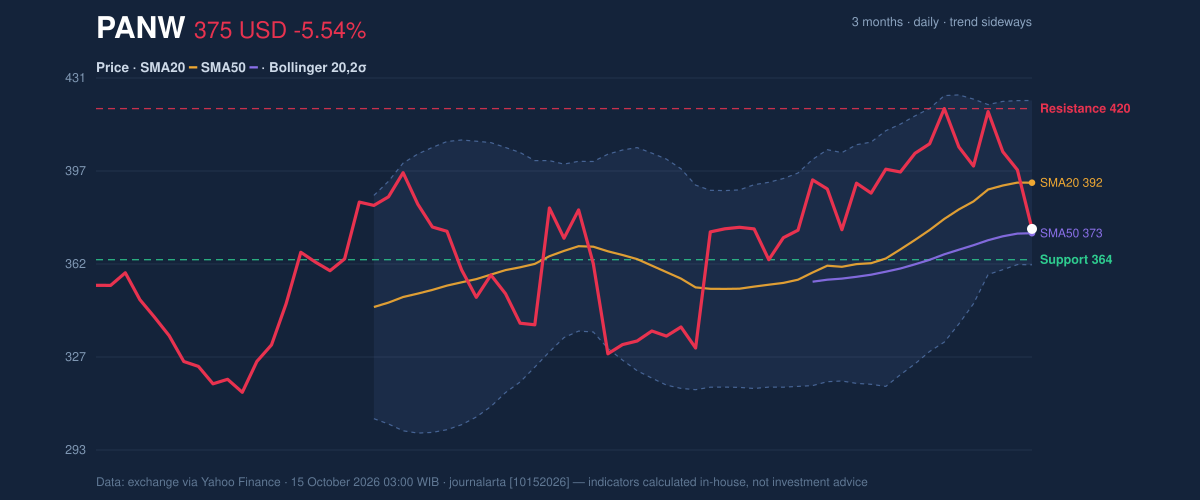
The stock’s sideways trend has not yet produced a new moving-average crossover. Its 20-day average, or SMA20, has risen 2.61% over five days, but that upward slope has not prevented the latest price from slipping below it. The 50-day average sits at $373.46, close to the last price of $375.04. This leaves PANW near a level that may help distinguish a short-lived pullback from further deterioration.
The price is below the SMA20 at $392.28 but just above the SMA50 at $373.46, a mixed technical picture rather than a confirmed change in the broader trend. The stock is also near the lower part of its 20-day trading range, at 20% of the distance between support at $363.58 and resistance at $419.91. The three-month range remains wider, from $308.54 to $432.33.
As shown in the chart, the Bollinger Bands place the lower band at $361.66 and the upper band at $422.91. Bollinger Bands measure how far price has moved from its recent average; the current 22% position within the bands puts PANW in the lower portion, but the normal band width does not signal an unusually compressed market. The $363.58 support area and the lower band are close enough to make the area around them important to monitor.
3-month price action chart of PANW: price, SMA20/50, Bollinger, support & resistance. Data: exchange via Yahoo Finance.
Oscillators & Momentum
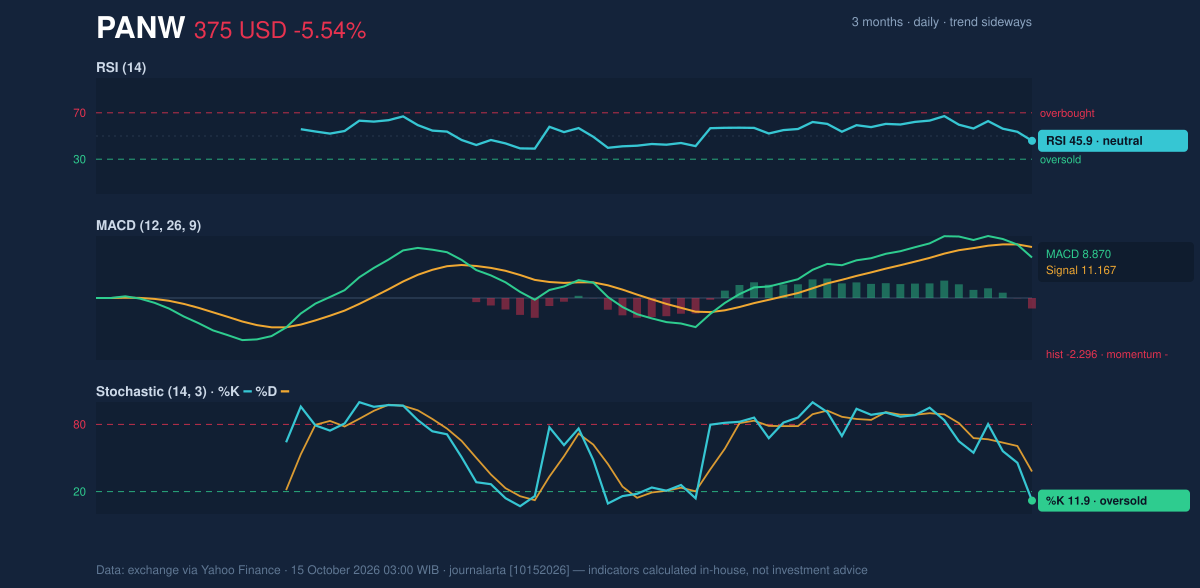
Momentum indicators lean weaker than the sideways trend label alone might suggest. The RSI is neutral at 45.9; the Relative Strength Index tracks the speed of recent gains and losses, and this reading does not indicate an extreme condition. The Stochastic oscillator, which compares the latest price with its recent range, is oversold: %K is 11.9 and %D is 38.0. Oversold readings can accompany a rebound, but they are not a signal that a reversal has already occurred.
The MACD reinforces the caution. Its line is at 8.870, below the 11.167 signal line, with a negative histogram of -2.296. The histogram measures the gap between those lines; a negative reading indicates weakening momentum. Taken together, the oversold Stochastic and negative MACD show a market that has fallen sharply but has not yet confirmed a turn higher.
Momentum chart of PANW: RSI(14), MACD, Stochastic. Data: exchange via Yahoo Finance.
Volatility & Volume
PANW traded 7,142,700 shares, about 1.3 times its 20-day average of 5,679,495. Higher-than-usual activity gives the decline more weight than a move on thin trading would carry. OBV, which uses trading volume to track whether activity is accumulating on up or down days, is also falling. That points to selling participation rather than clear evidence of buyers absorbing the drop.
The Average True Range (ATR), a measure of typical price movement, is $17.68, or 4.7% of the share price. This indicates high volatility: moves around nearby technical levels may be substantial, not gradual. The normal Bollinger width, however, suggests this is not currently a band squeeze—the setup does not show volatility having narrowed unusually before a breakout.
Key Levels & Scenarios
Support is $363.58, with the lower Bollinger Band at $361.66. A sustained break below that zone would weaken the case that the current move is merely a pullback within a sideways structure. Conversely, holding support and reclaiming the SMA20 at $392.28 would help ease the immediate pressure. The 20-day resistance at $419.91 is the next stated ceiling; the upper Bollinger Band at $422.91 provides a nearby reference, not a guarantee of a price destination.
Technical Verdict: HOLD (wait & see)
The technical verdict is HOLD (wait & see), reflecting conflicting signals rather than a settled direction. First, PANW is below its rising SMA20 but remains just above the SMA50. Second, the oversold Stochastic contrasts with the negative MACD histogram, so momentum has not confirmed a rebound. Third, above-average volume and falling OBV add weight to the recent decline. The verdict is invalidated if price falls below $363.58 support.
- Ideal entry range: $361.66–$373.46, bounded by the lower Bollinger Band and SMA50.
- Exit target: $392.28–$419.91, from the SMA20 to 20-day resistance.
- Stop-loss protection: $361.66, the lower Bollinger Band; a break below $363.58 support would already invalidate the verdict.
For non-traders, this means the indicators do not yet show enough agreement to establish whether PANW’s decline is ending or continuing.
Summary Data PANW
Last price
375.04 USD
Change 1 day / 5 days / 1 month
-5.54% / -7.53% / -0.16%
Trend / MA-cross
sideways / none
SMA20 / SMA50
392.28 / 373.46
RSI (14) / Stochastic %K
45.9 / 11.9
Bollinger %B / ATR
22% / 17.68
Support / Resistance 20 days
363.58 / 419.91
Data as of
15 October 2026 03:00 WIB
Disclaimer: This technical analysis is generated automatically from exchange data (via Yahoo Finance) and indicators calculated by JournalArta, for information and education only. The verdict and the entry, target and stop-loss levels are not investment advice or a solicitation to buy or sell any security. Investment decisions and their risks rest solely with the reader.