AVGO Testing Support Level: Stock Drops 0.55% (October 15, 2026)
On October 15, 2026: price 344.33 USD, trend sideways, RSI 41.5, support 343.64, resistance 376.51. technical analysis of avgo stock. AVGO Testing Support…
Why AVGO is in focus today
- MACD histogram has just turned negative
Selected automatically from 32 NASDAQ (US) stocks by a technical-signal score with daily weighted randomisation — not a recommendation.
Trend & Price Action
Broadcom closed at US$344.33 on Nasdaq, down 0.55% from the previous close of US$346.25. The stock has fallen 4.39% over five trading days and 0.86% over one month. The immediate picture is sideways, but with the price below both its 20-day average of US$356.84 and its 50-day average of US$367.56. Those averages describe recent trading levels; being below them signals that buyers have not yet pushed shares back above the short- and medium-term trend benchmarks. There has been no new crossover between the averages. The 20-day average has edged up 0.44% over five days, but that mild rise has not translated into a price recovery. The shares sit just above the US$343.64 support level tracked across 20 trading days, leaving little room before that nearby floor is tested. The three-month range runs from US$334.61 to US$432.73, placing the current price much closer to its low than its high. As shown in the chart, the lower Bollinger Band—an indicator that tracks price relative to recent volatility—stands at US$339.48, while the middle band is US$356.84. A reading of 14% on the band’s position measure places the price near the lower edge of its recent trading envelope, not at an extreme that alone proves a rebound is due.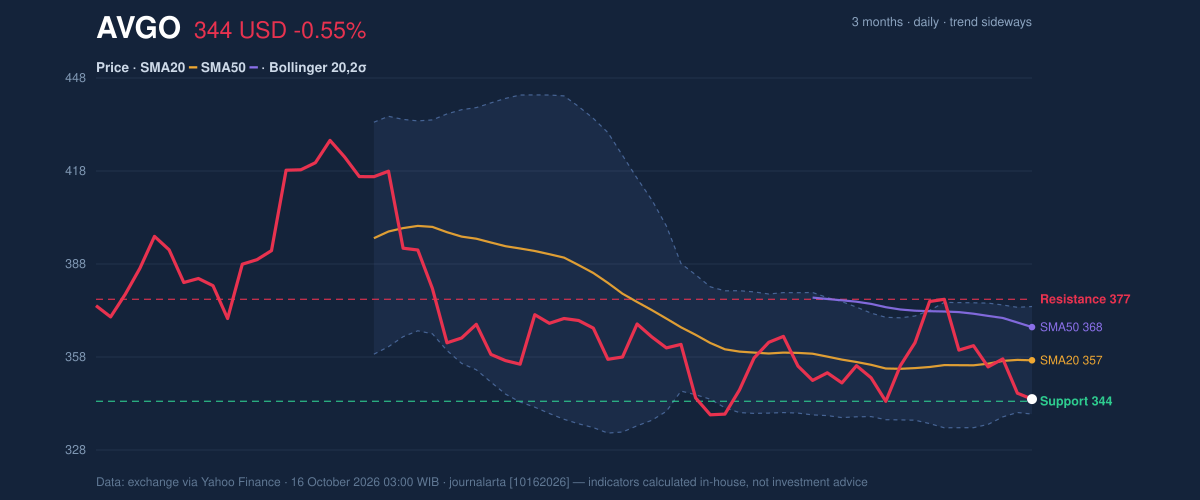
Oscillators & Momentum
The main change is the MACD histogram’s shift into negative territory. MACD compares short- and longer-term price momentum; its reading is -2.830 against a signal line of -2.225, leaving a histogram of -0.605. The negative histogram suggests downward momentum has gained the upper hand, although it is not, by itself, proof that the decline will continue. Other momentum gauges are less decisive. The 14-day RSI, which measures the pace of recent gains and losses, is 41.5 and classed as neutral. Stochastic readings are also neutral, with %K at 21.0 and %D at 22.5. RSI at 41.5 and Stochastic at 21.0/22.5 point to subdued momentum, rather than a confirmed oversold reversal—a distinction that matters when the MACD is deteriorating.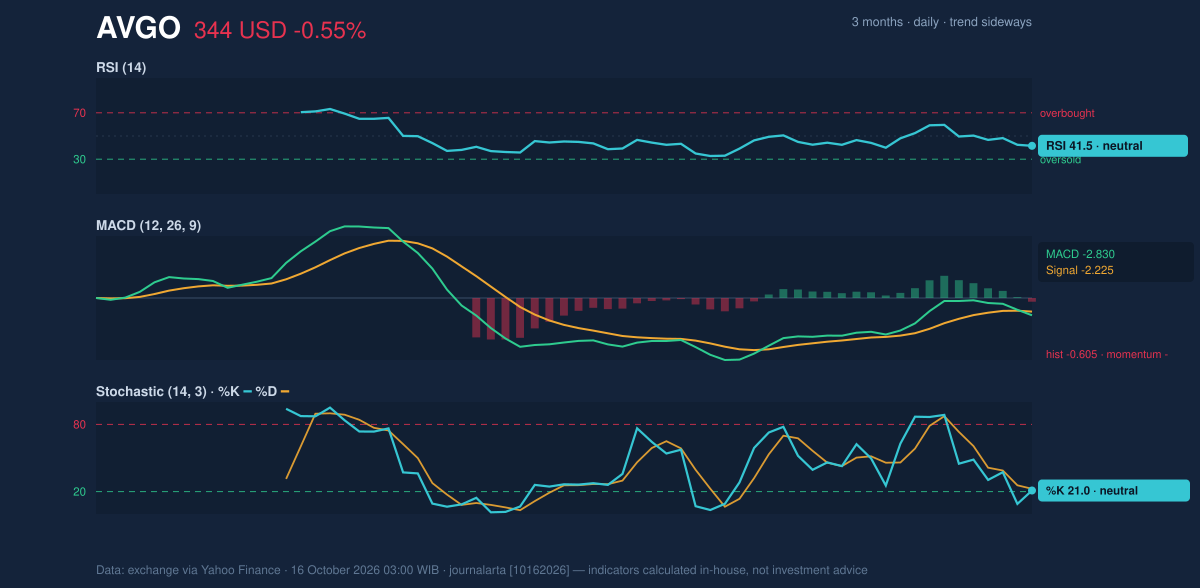
Volatility, Volume & Key Levels
The Bollinger Bands are 9.7% wide, a normal reading rather than a signal of unusually compressed or expanding volatility. Average true range, which estimates typical daily movement, is US$11.29, or 3.3% of the share price. That indicates moderate volatility: moves around support or resistance may be meaningful, but the data do not point to an exceptional volatility regime. Volume reached 28,415,900 shares, about 1.2 times the 20-day average of 23,043,165. On-balance volume, a running measure that adds volume on rising sessions and subtracts it on falling ones, is rising. Heavier-than-normal trading alongside rising OBV offers evidence of participation, but it has not yet outweighed the negative MACD signal or lifted the price above its moving averages. The next test is the nearby support at US$343.64; beneath it, the lower Bollinger Band at US$339.48 and the three-month low of US$334.61 provide further reference points. On the upside, the 20-day resistance level is US$376.51, close to the upper Bollinger Band at US$374.19. A recovery through those levels would need to be judged alongside the SMA20 at US$356.84 and SMA50 at US$367.56, where the price would first have to regain ground lost to its trend averages.Technical Verdict: HOLD (wait & see)
The indicators support a neutral stance rather than a confirmed directional move. The price is below the SMA20 and SMA50, the MACD histogram has turned negative, and RSI and Stochastic remain neutral; rising OBV and above-average volume provide a counterweight, not confirmation of a recovery. - Ideal Entry Range: US$339.48–US$343.64, bounded by the lower Bollinger Band and 20-day support. - Exit Target (Target Price): US$356.84–US$376.51, from the SMA20 to 20-day resistance. - Stop Loss: US$334.61, the three-month low and the next lower reference in the supplied data. - Invalidation: The HOLD assessment is invalidated if the price falls below US$334.61. For non-traders, the indicators show a weak near-term trend but not enough evidence to settle whether the next move will be a sustained recovery or a break lower.Data
Market data sourced from the exchange via Yahoo Finance, as of 16 October 2026, 03:00 WIB. Last price: US$344.33; previous close: US$346.25; 1-day change: -0.55%; 5-day change: -4.39%; 1-month change: -0.86%; SMA20: US$356.84; SMA50: US$367.56; Bollinger upper/middle/lower: US$374.19/US$356.84/US$339.48; RSI(14): 41.5; Stochastic %K/%D: 21.0/22.5; MACD/signal/histogram: -2.830/-2.225/-0.605; ATR(14): US$11.29; volume: 28,415,900; 20-day average volume: 23,043,165; OBV: rising; 20-day support/resistance: US$343.64/US$376.51; three-month high/low: US$432.73/US$334.61.Summary Data AVGO
| Last price | 344.33 USD |
| Change 1 day / 5 days / 1 month | -0.55% / -4.39% / -0.86% |
| Trend / MA-cross | sideways / none |
| SMA20 / SMA50 | 356.84 / 367.56 |
| RSI (14) / Stochastic %K | 41.5 / 21.0 |
| Bollinger %B / ATR | 14% / 11.29 |
| Support / Resistance 20 days | 343.64 / 376.51 |
| Data as of | 16 October 2026 03:00 WIB |
Disclaimer: This technical analysis is generated automatically from exchange data (via Yahoo Finance) and indicators calculated by JournalArta, for information and education only. The verdict and the entry, target and stop-loss levels are not investment advice or a solicitation to buy or sell any security. Investment decisions and their risks rest solely with the reader.
Track AVGO stock price daily: live levels, support/resistance and our full AVGO analysis history.