LLY Stock Gains 3.55%, Testing Key Resistance In Focus
On October 15, 2026: price 1,251.61 USD, trend sideways, RSI 67.7, support 1,142.85, resistance 1,251.61. technical analysis of lly stock.
Why LLY is in focus today
- Volume at 1.6× the 20-day average
- Closed at a 20-day high (1,251.61)
Selected automatically from 30 NYSE (US) stocks by a technical-signal score with daily weighted randomisation — not a recommendation.
Trend & Price Action
Lilly’s shares are up 7.01% over five days and 8.61% over one month, although the broader trend classification remains sideways. The stock is above its 20-day simple moving average (SMA) of $1,173.56, while that average is rising by 1.33% over five days. Its 50-day average is $1,179.04, just above the 20-day average; there has been no recent crossover. That means the short-term strength has not yet produced a conventional moving-average signal of a sustained trend change. The price has also advanced well beyond both averages, a gap that underlines the force of the latest move but can make the shares more vulnerable to a pullback toward those trend measures. The three-month range, from $1,109.15 to $1,292.65, provides broader context: the latest close is near the upper end, but not at the three-month high. As shown in the chart, price has pushed beyond the upper Bollinger Band, a volatility measure set at two standard deviations from its moving average. The upper band is $1,222.83 and %B is 129%, meaning the price is above that band; this can reflect powerful momentum, but is not by itself proof that a reversal is imminent. The band width of 8.4% is normal rather than unusually compressed, so the data do not point to a classic volatility squeeze before the breakout.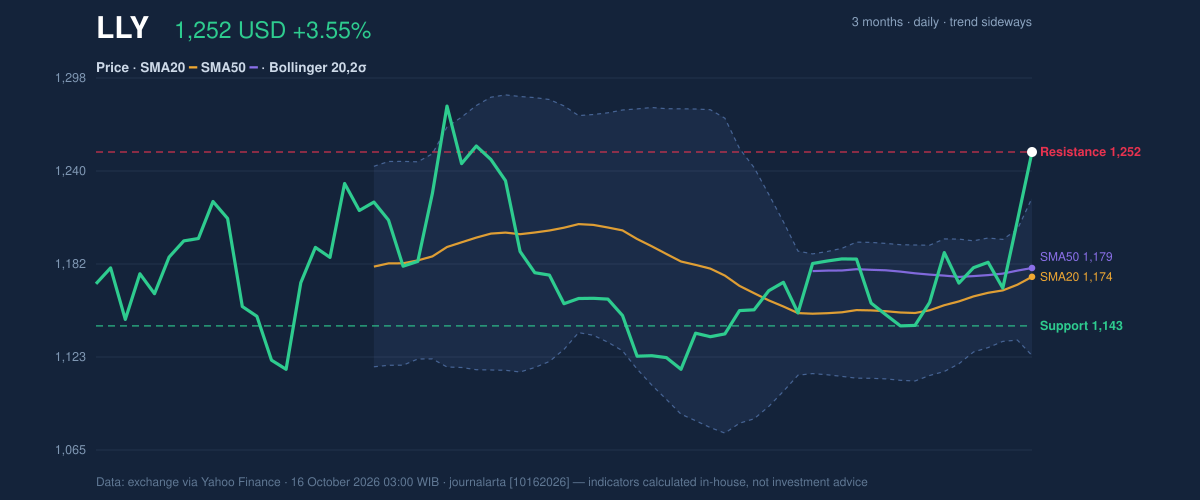
Oscillators & Momentum
Momentum indicators broadly support the price advance, though one is flashing a caution. MACD is positive at 10.523, above its 2.354 signal line, with a positive 8.169 histogram. MACD compares shorter- and longer-term price momentum; its positive readings suggest upward pressure is strengthening rather than fading in the latest data. The RSI, which measures the pace of recent gains and losses, stands at 67.7 and is classified as neutral in the supplied data. That is elevated, but it has not crossed the conventional overbought threshold. By contrast, Stochastic %K at 83.2 and %D at 72.0 is overbought, indicating that the recent rise has been rapid relative to the stock’s recent trading range. Overbought readings can persist in a strong advance, but they also raise the chance that short-term buyers may pause or take profits.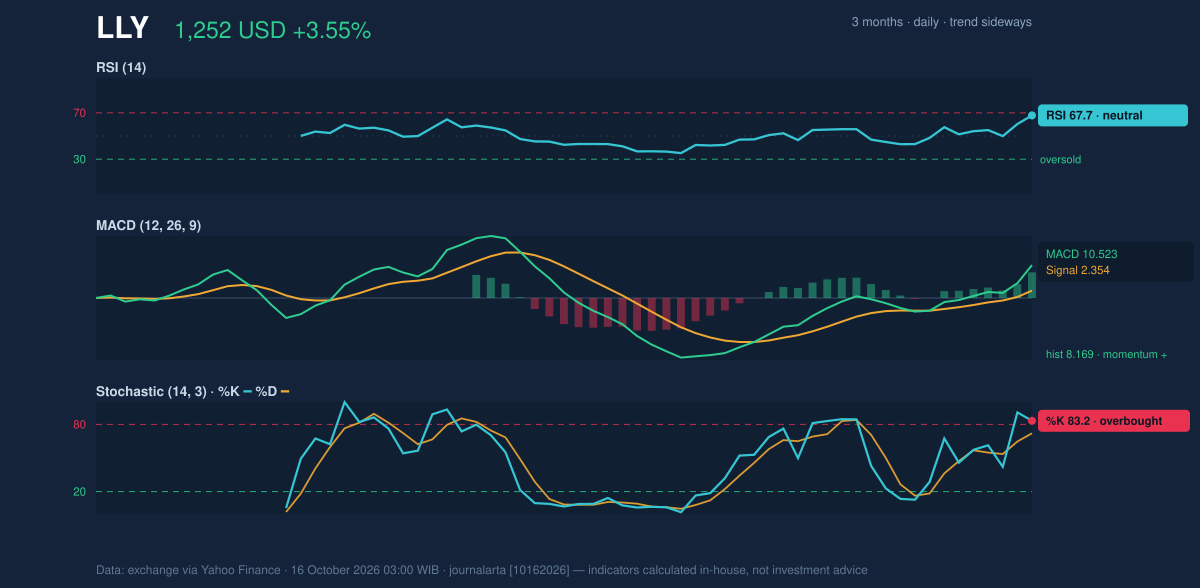
Volatility, Volume & Key Levels
Trading volume reached 3,752,100 shares, compared with a 20-day average of 2,406,635. The increase, together with rising on-balance volume (OBV), supports the view that the advance has attracted participation rather than being driven by a thin session. ATR, a measure of typical daily price movement, is $37.08, or 3.0% of the share price—moderate volatility that still allows for sizeable daily swings. The stated 20-day resistance is $1,251.61, exactly where the stock closed, while support is $1,142.85. A close above $1,251.61 would put the shares beyond that recorded resistance; failure to hold strength could leave the $1,173.56–$1,179.04 moving-average area as a nearer reference zone. A move below the $1,142.85 support would weaken the short-term setup. These are conditional levels, not predictions.Technical Verdict: HOLD (wait & see)
The indicators point to firm short-term momentum, but the stock’s position at the 20-day range ceiling and above its upper Bollinger Band argues for caution rather than a directional call. The verdict rests on three signals: positive MACD, rising OBV alongside above-average volume, and overbought Stochastic readings with price stretched above the upper band. The verdict is invalidated if the price falls below $1,142.85. - Ideal entry range: $1,173.56–$1,179.04, the SMA20–SMA50 area. - Exit target (target price): $1,251.61, the stated 20-day resistance. - Stop-loss protection: $1,142.85, the stated 20-day support. In plain English, the shares have strong momentum, but the current price is stretched enough that waiting for clearer confirmation may reduce the risk of chasing a short-term surge. Data table (NYSE: LLY; market data via exchange data reported by Yahoo Finance, as of Oct. 16, 2026, 03:00 WIB): | Measure | Reading | |---|---:| | Last price | $1,251.61 | | Daily change | +3.55% | | Five-day / one-month change | +7.01% / +8.61% | | SMA20 / SMA50 | $1,173.56 / $1,179.04 | | Bollinger upper / middle / lower | $1,222.83 / $1,173.56 / $1,124.29 | | RSI / Stochastic %K, %D | 67.7 / 83.2, 72.0 | | MACD / signal / histogram | 10.523 / 2.354 / 8.169 | | ATR | $37.08 (3.0%) | | Volume / 20-day average | 3,752,100 / 2,406,635 | | 20-day support / resistance | $1,142.85 / $1,251.61 | | Three-month high / low | $1,292.65 / $1,109.15 |Summary Data LLY
| Last price | 1,251.61 USD |
| Change 1 day / 5 days / 1 month | 3.55% / 7.01% / 8.61% |
| Trend / MA-cross | sideways / none |
| SMA20 / SMA50 | 1,173.56 / 1,179.04 |
| RSI (14) / Stochastic %K | 67.7 / 83.2 |
| Bollinger %B / ATR | 129% / 37.08 |
| Support / Resistance 20 days | 1,142.85 / 1,251.61 |
| Data as of | 16 October 2026 03:00 WIB |
Disclaimer: This technical analysis is generated automatically from exchange data (via Yahoo Finance) and indicators calculated by JournalArta, for information and education only. The verdict and the entry, target and stop-loss levels are not investment advice or a solicitation to buy or sell any security. Investment decisions and their risks rest solely with the reader.
Track LLY stock price daily: live levels, support/resistance and our full LLY analysis history.